
Key takeaways
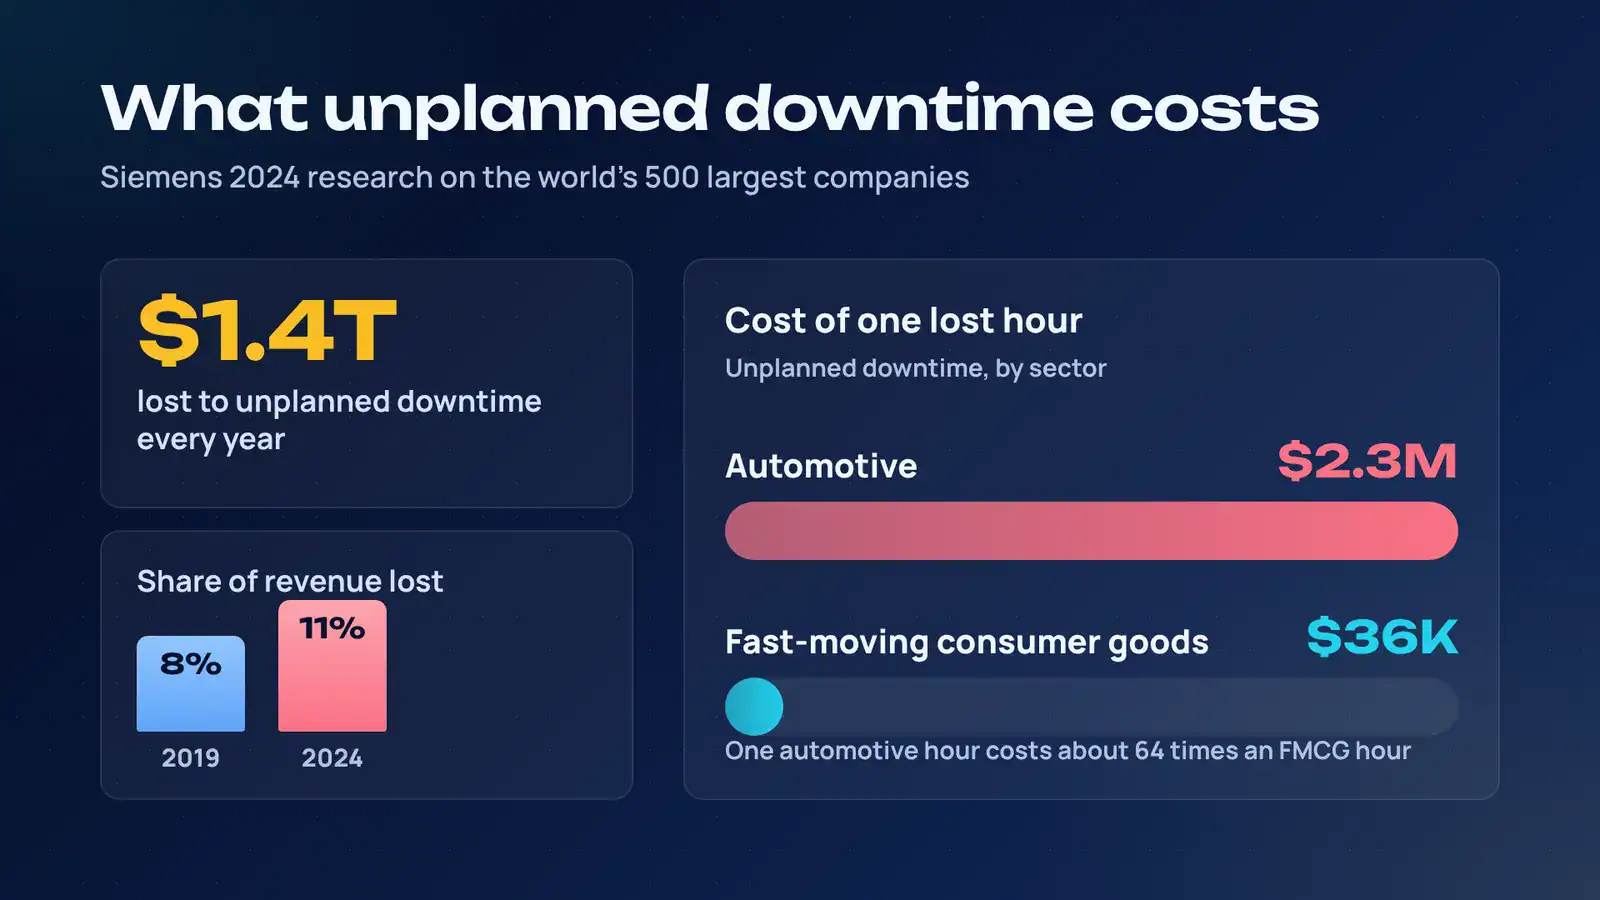
- Downtime is costly. Siemens estimates it costs the world’s 500 largest companies $1.4 trillion a year, or 11% of revenues.
- Predictive acts on condition, not the calendar. Sensor data and AI forecast failure so repairs happen at the right time.
- Match the method to your data. Anomaly detection needs only healthy data, classification needs labelled failures, and RUL needs run-to-failure histories.
- You can start without failure labels. Begin with anomaly detection and build labels from technician feedback.
- Pilot on actionable assets. Choose two or three with high failure cost, enough frequency and real lead time.
- Alerts must become work orders. Value comes from the CMMS action, so track precision, recall and lead time.
- Measure ROI against a baseline. Capture downtime, MTBF and MTTR before the pilot, then subtract total costs from total benefits.
- Be cautious with vendor benchmarks. Use conservative assumptions and let your pilot supply the real numbers.
- Run a 90-day pilot. Scope, baseline, tune, then integrate and review ROI.
Unplanned downtime is expensive, and the cost keeps climbing. Siemens’ 2024 research estimates that unplanned downtime costs the world’s 500 largest companies $1.4 trillion a year, about 11% of revenues, up from 8% in 2019. In automotive, a single lost hour costs $2.3 million, while fast-moving consumer goods sits at the low end at $36,000.
That is the case for predictive maintenance AI: using sensor data and machine learning to fix equipment when it needs it, not after it fails or on a calendar. This guide covers the asset-reliability side only: which assets to monitor, which model fits your data, how alerts reach technicians, and how to prove ROI. It does not cover task execution or warehouse orchestration. If you want a partner for the build, Cubix AI works on exactly this problem.
Quick self-check: When your last critical machine failed, did you know it was coming? If not, keep reading.
What Is AI Predictive Maintenance?
Definition: AI predictive maintenance uses sensor data, such as vibration, temperature and current, and machine learning models to detect early signs of equipment degradation. It estimates when a failure is likely, so teams can schedule repairs before breakdowns interrupt operations.
Here is how it works in a factory, step by step:
- Sense. IoT sensors attached to assets collect data on variables such as temperature, pressure, vibration, humidity, acoustic emissions and rotational speed.
- Baseline. The system learns what “healthy” looks like for each asset. These baselines represent healthy ranges under normal operating conditions.
- Analyse. Models flag deviations. The main techniques are anomaly detection (is this unusual?), fault classification (which failure mode is this?) and remaining useful life (RUL) prediction (how long until it fails?). Core capabilities include real-time anomaly detection, supervised failure-mode prediction, RUL estimation and root cause analysis from multi-sensor data.
- Alert. A prioritised alert reaches the maintenance team.
- Act. A computerized maintenance management system (CMMS) can then schedule the work, generate a work order and even assign a technician.
This is condition-based maintenance (CBM) with a learning layer. CBM triggers work when a threshold is crossed. AI adds pattern recognition across many signals, so it can catch combinations no single threshold would. For the analytics foundation, see Cubix’s Predictive Analytics Solutions.
Predictive vs Preventive Maintenance (Including for Fleets)
Reactive maintenance happens after a failure, while preventive maintenance follows time or usage schedules, which can trigger unnecessary work. Predictive maintenance sits at the far end of that spectrum.
| Reactive | Preventive | Condition-based | Predictive (AI) | |
|---|---|---|---|---|
| Trigger | Failure | Calendar or mileage | Threshold breach | Learned patterns and forecasts |
| Cost profile | Low upfront, highest per event | Predictable, with over-servicing | Moderate | Higher setup, lower run cost |
| MTBF impact | None | Moderate | Good | Strongest on monitorable failure modes |
| MTTR impact | Worst (parts and labour scramble) | Better | Better | Best (parts staged before the job) |
| Best fit | Cheap, redundant assets | Wear items with known life | Assets with a clear measurable symptom | Critical, costly or hard-to-replace assets |
The fleet angle. A truck on a mileage-based schedule gets its service whether or not it needs it, and still breaks down between services. Telematics-driven prediction watches engine diagnostics, oil condition and battery health, and triggers work by condition. One fleet-focused vendor cites 2026 benchmark data showing that 52% of fleet managers using AI predictive maintenance report reduced vehicle downtime.
Interactive: Where Is Your Operation Today?
Score each question (A = 1 point, B = 2, C = 3, D = 4):
1. How do you learn that a critical asset is failing?
A) It stops · B) An operator notices · C) A threshold alarm fires · D) A model forecasts it
2. What triggers most of your maintenance work?
A) Breakdowns · B) The calendar or mileage · C) Inspection findings · D) Condition data
3. How connected are your maintenance records?
A) Paper or spreadsheets · B) A CMMS with partial data · C) A CMMS or EAM with clean failure codes · D) CMMS plus sensor history
4. Can you state your MTBF and MTTR for your top ten assets?
A) No · B) Roughly · C) Yes, from the CMMS · D) Yes, and we track them monthly
Your score:
- 4–7: Reactive-leaning. Fix data capture first. Standardise failure codes in your CMMS before buying anything.
- 8–11: Preventive-plus. You are ready for a focused pilot on two or three assets.
- 12–16: Condition-based. AI can extend your thresholds into forecasts. Start with RUL or anomaly detection on your best-instrumented assets.
Where Predictive Maintenance Pays Off
Production Machinery
CNC spindles, motors, pumps, compressors and gearboxes are the classic targets. Vibration analysis is one of the most widely used techniques for rotating equipment such as pumps, compressors, motors, fans and centrifuges, where it identifies misalignment, imbalance and looseness. Temperature monitoring and motor current analysis add coverage for electrical and lubrication faults.
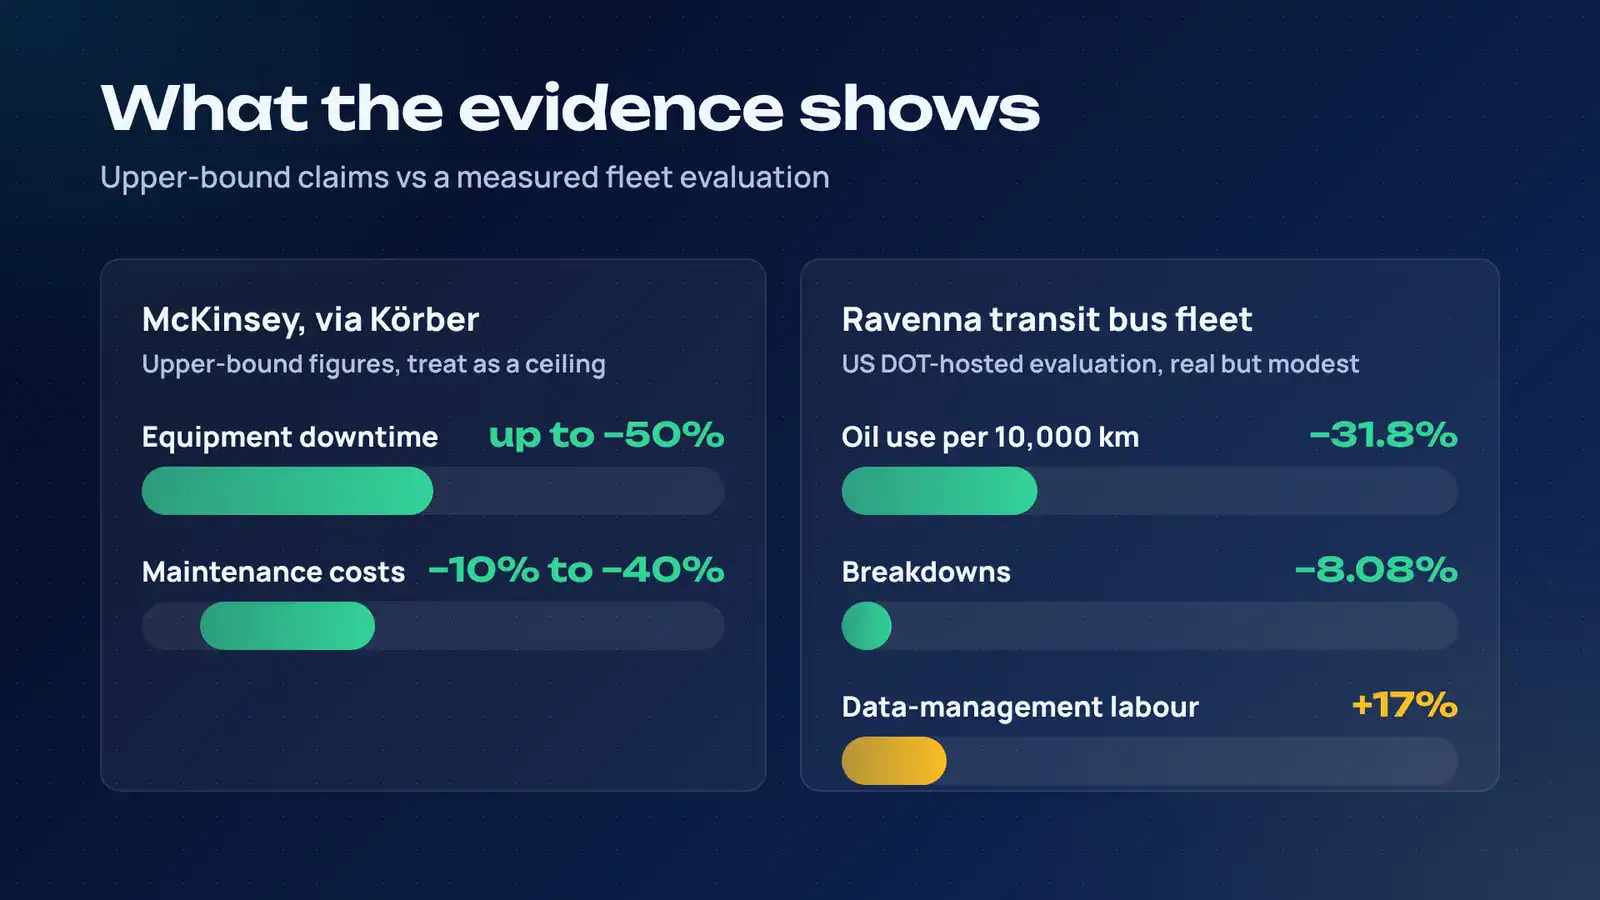
Stat callout: Körber cites McKinsey in reporting that predictive maintenance can cut equipment downtime by up to 50% and maintenance costs by 10% to 40%. These are upper-bound figures, so treat them as a ceiling.
Conveyors and Sortation
Conveyor drives, rollers and sorter motors are high-consequence assets. When one stops, throughput stops with it. iFactory’s logistics guide lists conveyor bearing vibration, belt tracking, drive motor temperature and divert actuator response as monitorable signals. The same source claims 40-65% fewer material handling failures and 3-6 month payback. That is a vendor claim, and the range is wide, so validate it against your own baseline.
Stat callout (vendor-reported): iFactory estimates a conveyor or AGV breakdown during peak sortation costs 4,500 per hour once SLA penalties and overtime are counted. Your figure will differ, so calculate your own.
Fleets
Fleet predictive maintenance uses engine fault codes, oil analysis, battery data and telematics. One honest data point comes from a US DOT-hosted evaluation of a predictive system on a transit bus fleet in Ravenna, Italy. Oil use per 10,000 km fell 31.8% and breakdowns fell 8.08%, but the labour needed for data management rose 17%. The result is real but modest, and it shows that predictive systems have an operating cost too. Vendor claims of 45–70% breakdown reductions are best read as best-case scenarios.
What Sensors and Data Do You Need?
Match the signal to the failure mode. Do not instrument everything.
| Signal | Failure modes it reveals | Typical assets |
|---|---|---|
| Vibration | Imbalance, misalignment, bearing wear, looseness | Motors, pumps, fans, gearboxes |
| Temperature | Overload, friction, cooling failure | Motors, bearings, electrical cabinets |
| Motor current | Rotor faults, load change, insulation issues | Drives, conveyors, compressors |
| Acoustic / ultrasonic | Air leaks, early bearing faults | Compressors, bearings, valves |
| Oil analysis | Contamination, metal particles, viscosity change | Gearboxes, engines, hydraulics |
| Pressure | Leaks, blockages, pump wear | Hydraulics, pneumatics |
| GPS / telematics | Usage, duty cycle, fault codes | Trucks, forklifts, vans |
Architecture: edge or cloud? An IoT predictive maintenance stack usually runs fast, simple inference at the edge and heavier model training in the cloud. Edge AI supports fast response, keeps working during network outages, reduces bandwidth by sending only summaries and alerts, and keeps data on site.
Data pitfalls to plan for:
- Sensor drift. Sensors degrade, so a “new normal” can be a calibration problem and not a fault.
- Missing or noisy data. Gaps during shift changes or network drops can look like anomalies.
- Legacy equipment. Many legacy systems lack the sensors or digital interfaces needed, so retrofits or data translation layers are required.
- The data you already have. Historian data, PLC tags, and CMMS or EAM work-order history are often the fastest starting point. Many modern machines already have built-in sensors, so the job is often to centralise their data.
Choosing the Right Method
| Method | Question it answers | Needs | Best for |
|---|---|---|---|
| Anomaly detection | “Is this behaving abnormally?” | Healthy data only | Fast starts, unknown failure modes |
| Fault classification | “Which fault is this?” | Labelled failure examples | Well-understood, recurring faults |
| RUL prediction | “How long until it fails?” | Run-to-failure histories | Wear-driven assets with a degradation curve |
How to Start Without Failure Labels
Yes, a model can work without labelled failures. Most pilots begin that way, since rare failures leave few labels. The practical path:
- Unsupervised baselining. Train an anomaly model on normal operation, with no failure examples needed.
- Mine your work orders. Match past repair dates to sensor history to create weak labels.
- Use technician feedback. Every confirmed or rejected alert becomes a new failure label.
- Graduate the method. Move from anomaly detection to classification, then RUL, as labels accumulate.
Data check: Dataverse says many pilots start with 6 to 12 months of sensor data plus maintenance incident history, not years of it.
Interactive: Which Method Fits You?
Answer from the top:
- Do you have labelled failures for this asset?
- No → Start with anomaly detection.
- Yes → Continue.
- Do you have run-to-failure histories showing gradual degradation?
- Yes → Try RUL prediction.
- No → Use fault classification.
- Is the failure sudden, with no measurable precursor?
- Yes → Prediction will struggle. Use inspection or redundancy instead.
How to Pick Your First Pilot Assets
Which equipment is best for a first pilot? Score candidates on three criteria:
- Failure cost: downtime, repair, safety and knock-on delays
- Failure frequency: enough events to learn from and justify the work
- Actionability: a detectable precursor, enough lead time to act, and spare parts available
Dataverse recommends starting with the two or three machines whose failure most affects production or repair cost. iFactory similarly advises starting with a single system, proving ROI within about 90 days, then expanding.
Interactive: Asset-Scoring Worksheet
Score each asset 1–5 per criterion. Rule: if actionability is 2 or below, disqualify the asset.
| Asset | Failure cost | Frequency | Actionability | Total /15 | Verdict |
|---|---|---|---|---|---|
| Sorter drive motor | 5 | 3 | 4 | 12 | Pilot |
| Packaging gearbox | 4 | 2 | 4 | 10 | Candidate |
| Delivery van batteries | 3 | 4 | 4 | 11 | Pilot (fleet) |
| Air compressor (sudden failure, no spares) | 4 | 2 | 2 | 8 | Disqualified |
| Your asset | _ | _ | _ | _ | _ |
Red flags: failures too rare to learn from, no warning time, no spare parts, or no one to act on the alert.
From Alert to Action: Integrating With Your CMMS/EAM
A model nobody acts on has zero value. Design the alert around the technician’s next step.
A good alert contains:
- Asset and location
- Severity and confidence
- Suspected failure mode (for example, “bearing wear, outer race”)
- Estimated lead time (“inspect within 10 days”)
- Recommended action and parts to stage
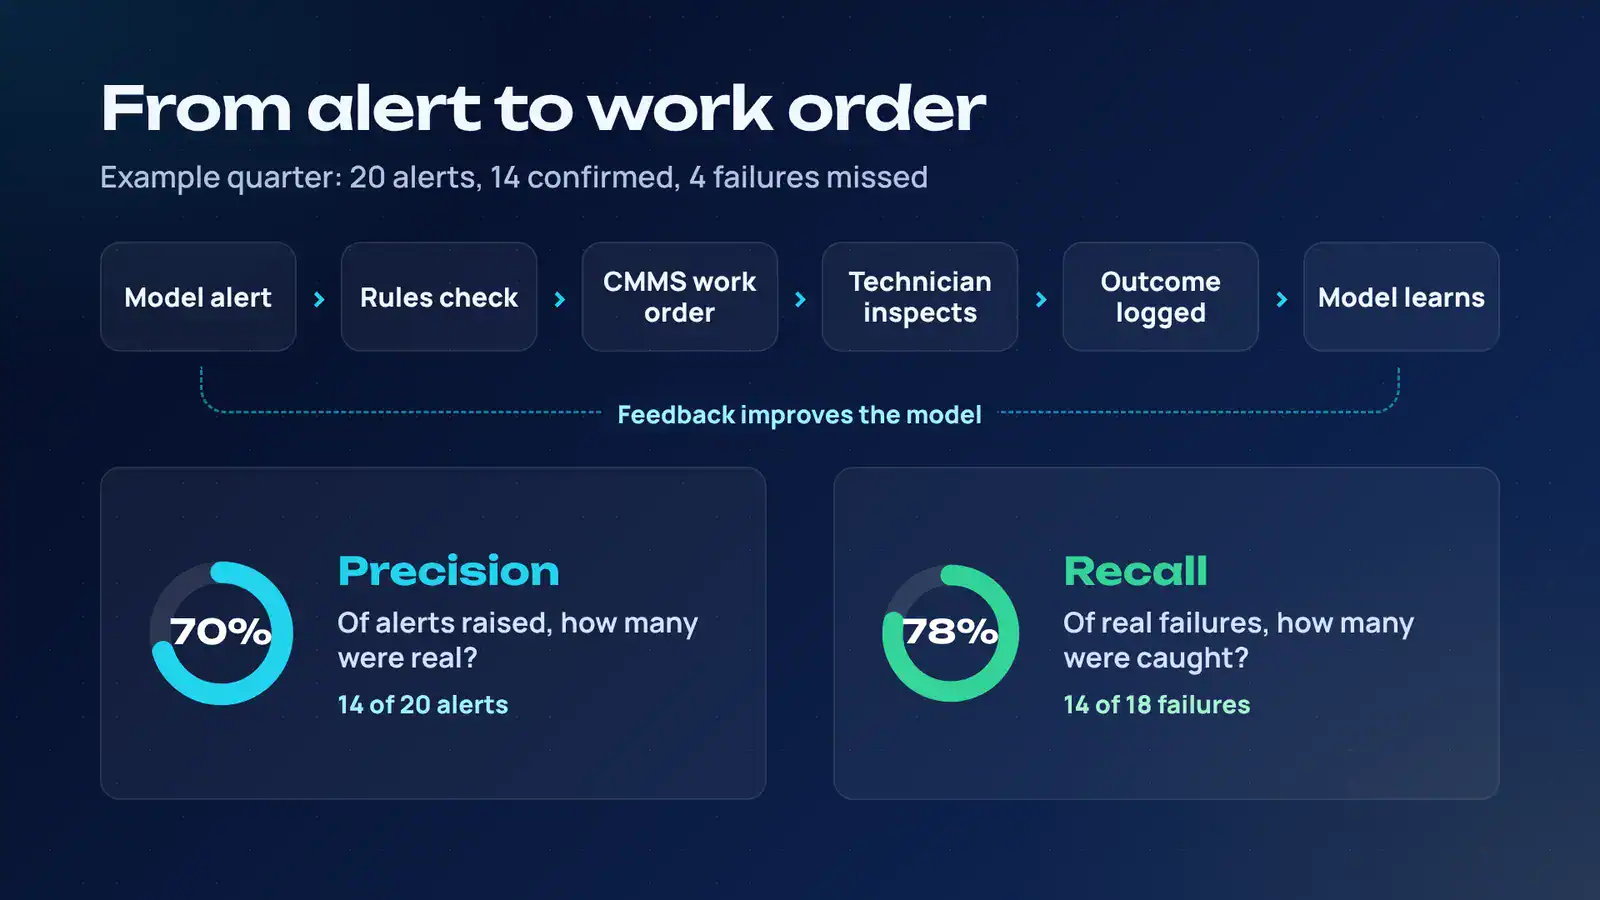
The work-order flow: model alert → rules check (severity, confidence, asset criticality) → CMMS work order auto-created → technician inspects → outcome logged (confirmed, false alarm, or not found) → feedback returns to the model. Predictive tools can automate work orders, inspection scheduling and parts management.
Cutting false alarms:
- Set confidence thresholds per asset class, not globally.
- Run in shadow mode first. iFactory’s deployment path logs alerts without acting on them and compares them with actual breakdown events before tuning.
- Require technician confirmation before escalating low-confidence alerts.
- Close the feedback loop every time.
Metrics that matter:
- Precision: of the alerts raised, how many were real? Low precision means alert fatigue.
- Recall: of the real failures, how many did you catch? Low recall means missed breakdowns.
- False-alarm rate and lead time: is there enough warning to act?
Example: 20 alerts in a quarter, 14 confirmed, and 4 failures missed. Precision = 14/20 = 70%. Recall = 14/(14+4) = 78%. If your technicians lose trust at 70% precision, raise the threshold and accept lower recall on non-critical assets.
Predictive Maintenance ROI: How to Calculate It
Formula:
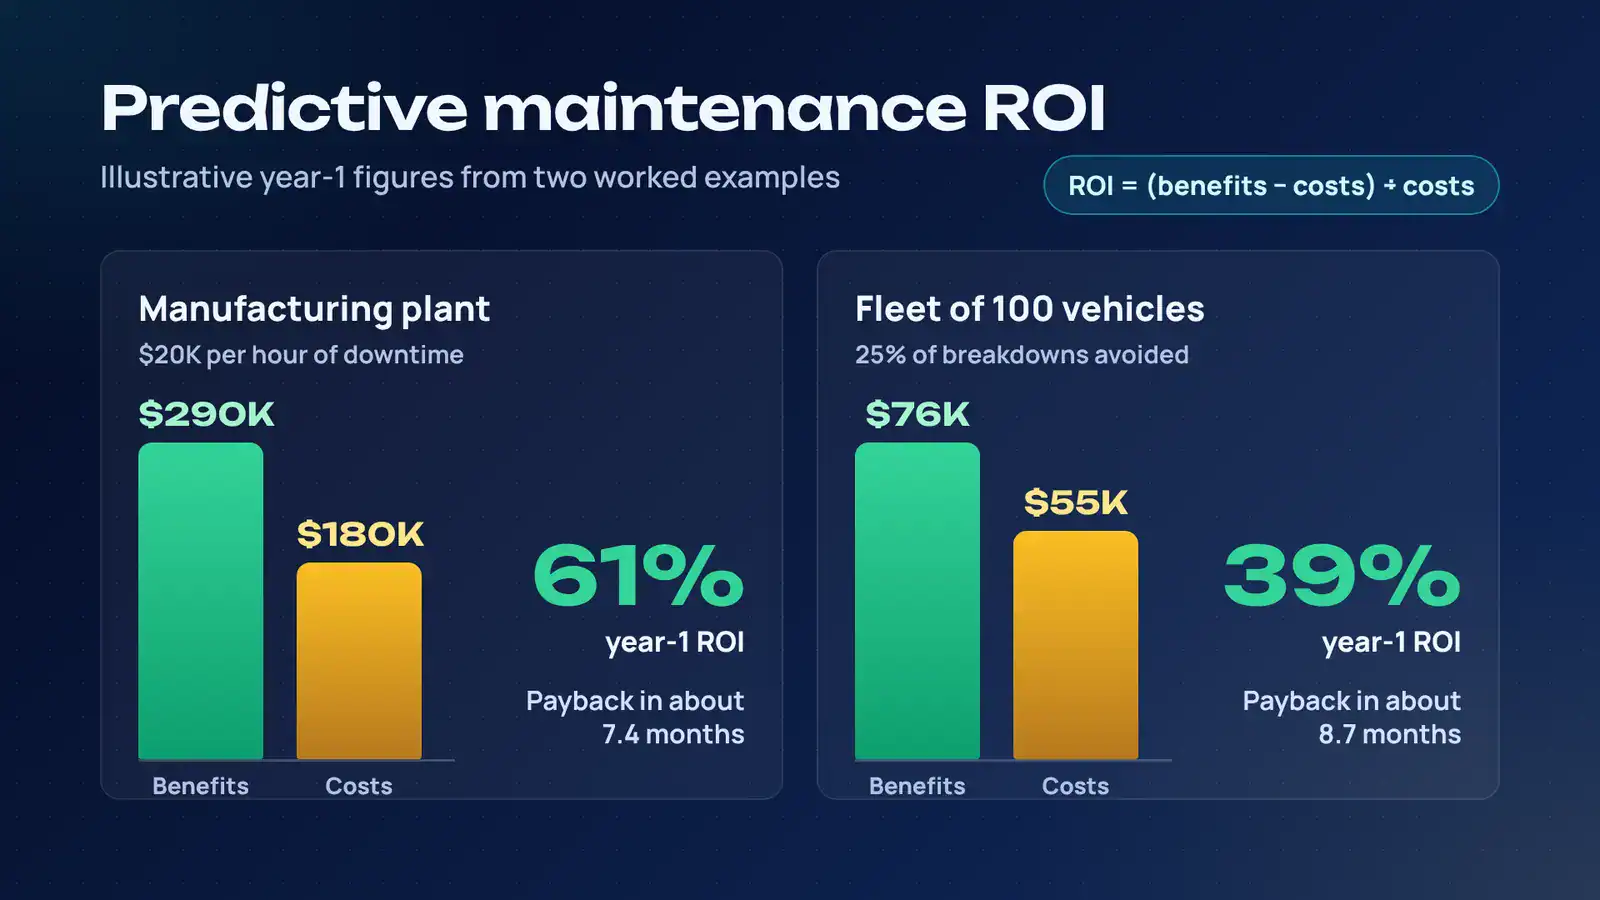
ROI % = (Annual benefits − Annual costs) ÷ Annual costs × 100
Benefits: avoided downtime, lower emergency repair and parts costs, extended asset life, reduced overtime and expediting.
Costs: sensors, integration, licences, cloud or edge compute, training and ongoing support (including the data-management labour the Ravenna study flagged).
Worked Example: Plant (illustrative figures)
| Item | Value |
|---|---|
| Downtime cost on pilot lines | $20,000/hour |
| Unplanned downtime avoided | 12 hours/year → $240,000 |
| Emergency vs planned repair savings | 6 events × $6,000 → $36,000 |
| Overtime and expediting avoided | $14,000 |
| Total benefits | $290,000 |
| Sensors and installation | $60,000 |
| Integration | $50,000 |
| Licences and support | $70,000/year |
| Year-1 costs | $180,000 |
| Year-1 ROI | 61% (payback ≈ 7.4 months) |
Worked Example: Fleet of 100 Vehicles (illustrative figures)
| Item | Value |
|---|---|
| Unplanned breakdowns | 150/year at $1,500 all-in |
| Avoided (25%) | ~38 events → $56,250 |
| Unneeded service avoided | $200 × 100 vehicles → $20,000 |
| Total benefits | $76,250 |
| Telematics integration + software | $55,000 |
| Year-1 ROI | 39% (payback ≈ 8.7 months) |
Interactive: Plug In Your Numbers
| Step | Your input |
|---|---|
| A. Downtime cost per hour | $____ |
| B. Unplanned hours on pilot assets per year | ____ |
| C. Realistic reduction (start at 20–30%) | ____% |
| D. Avoided downtime value = A × B × C | $____ |
| E. Repair, parts and overtime savings | $____ |
| F. Total benefits = D + E | $____ |
| G. Total annual costs | $____ |
| ROI % = (F − G) ÷ G × 100 | ____% |
Benchmarks, with caveats. IBM’s guide, citing third-party reports, says predictive maintenance can reduce maintenance costs by 18% to 31%. Dataverse reports 30–50% less unplanned downtime and 10:1 to 30:1 returns within 12–18 months. These are vendor and secondary-source numbers, and your result depends on asset mix and execution. Use a conservative downtime-reduction assumption, then let the pilot measure the real one.
Your 90-Day Pilot Roadmap
| Weeks | Focus | Deliverable |
|---|---|---|
| 1–2 | Scope and asset selection | Scored shortlist, failure definitions, baseline MTBF/MTTR and downtime cost |
| 3–6 | Data and baseline | Data audit, sensor gaps closed, first anomaly baseline |
| 7–10 | Model and alert tuning | Shadow-mode alerts, tuned thresholds, precision/recall tracked |
| 11–13 | CMMS integration and ROI review | Live work orders, before/after comparison, scale-or-stop decision |
Common mistakes:
- Monitoring everything instead of two or three assets
- Choosing assets that fail suddenly, with no precursor
- Skipping shadow mode, then losing technician trust to false alarms
- Never recording alert outcomes, so the model cannot learn
- Not capturing a baseline, so ROI cannot be proven
- Underestimating cultural resistance, since maintenance teams unfamiliar with AI workflows need training and clear ROI goals.
Conclusion: Start Small, Measure Honestly, Scale What Works
- Pick actionable assets. Two or three critical machines with real lead time beat a plant-wide rollout.
- You do not need failure labels to start. Begin with anomaly detection and build labels from technician feedback.
- Alerts must reach a work order. The value comes from the CMMS action, not the model.
Ready to scope a pilot? Talk to the team at Cubix AI about your assets, or explore how we apply AI in Manufacturing.
Start your predictive maintenance AI pilot today
Contact UsFrequently Asked Questions
1. How is predictive maintenance different from preventive maintenance?
Preventive maintenance follows a fixed schedule based on time or usage, so it can replace healthy parts. Predictive maintenance acts on actual asset condition, using sensor data and models to forecast failure and time the intervention.
2. Can predictive maintenance AI work without labeled failures?
Yes. Start with unsupervised anomaly detection trained on normal operation. Add weak labels from work-order history, then build proper failure labels from technician feedback. Classification and RUL models come later, once labelled events exist.
3. Which equipment is best for a first pilot?
Pick assets with high failure cost, enough failure frequency to learn from, and actionability: a measurable precursor, lead time to act and spare parts on hand. Critical conveyor drives, motors, pumps and key fleet components often fit.
4. How does AI create maintenance alerts or CMMS work orders?
Models score incoming sensor data. When a score crosses a severity and confidence threshold, an integration (usually via API) creates a work order in the CMMS or EAM with the asset, suspected failure mode, urgency and recommended action. Technician outcomes then feed back into the model.
5. How can manufacturers and logistics firms measure ROI?
Capture baselines before the pilot: unplanned downtime hours, MTBF, MTTR, emergency repair cost and overtime. After the pilot, compare the same metrics and subtract total costs (sensors, integration, licences, support). Use the calculator above.