Key Takeaways
- A true digital twin stays connected to live data, unlike a static model or one-off simulation.
- It answers “what happens if?” against your current network, not last quarter’s snapshot.
- Start with supplier outages, port closures, and demand shocks, and compare every fix against a baseline.
- Calibrate and validate the model before trusting it, and expect ranges, not single numbers.
- AI improves the inputs and the search, while simulation keeps results explainable.
- Start small: one costly decision, one bounded network, then scale.
It’s 11 p.m. A port that handles a third of your inbound containers has just announced an indefinite closure. Your planner has a spreadsheet, a half-dozen unanswered emails, and a decision to make: reroute now and pay a premium, or wait and risk missing a promotional launch window.
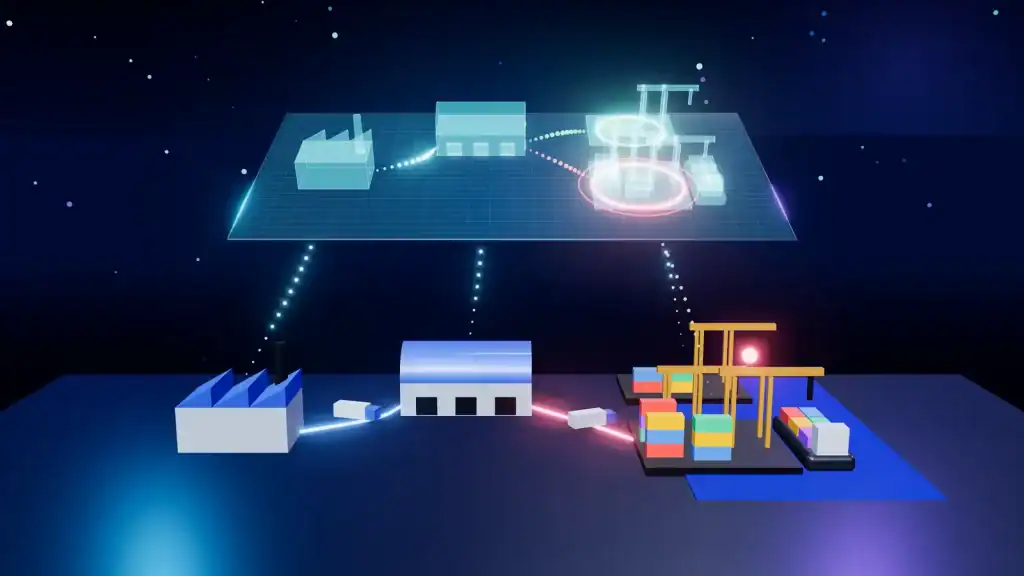
In most organizations, that decision is still made on instinct plus a scramble that can take days. Supply chain digital twins change the sequence. Instead of discovering the damage after a disruption hits, teams run the disruption first, on a living virtual replica of the network, and compare their options before committing a single truck, dollar, or unit of inventory.
This guide covers what a supply chain digital twin actually is, how it differs from a dashboard or a one-off simulation, what data it needs, how to trust its answers, what it costs, and how to start with a pilot that proves value in months rather than years.
Quick poll (answer honestly): When your last major disruption hit, how long did it take to evaluate your response options? A) Hours B) One to two days C) Three days or more. If you answered B or C, keep reading. That gap is exactly what a twin is built to close.
What Is a Supply Chain Digital Twin?
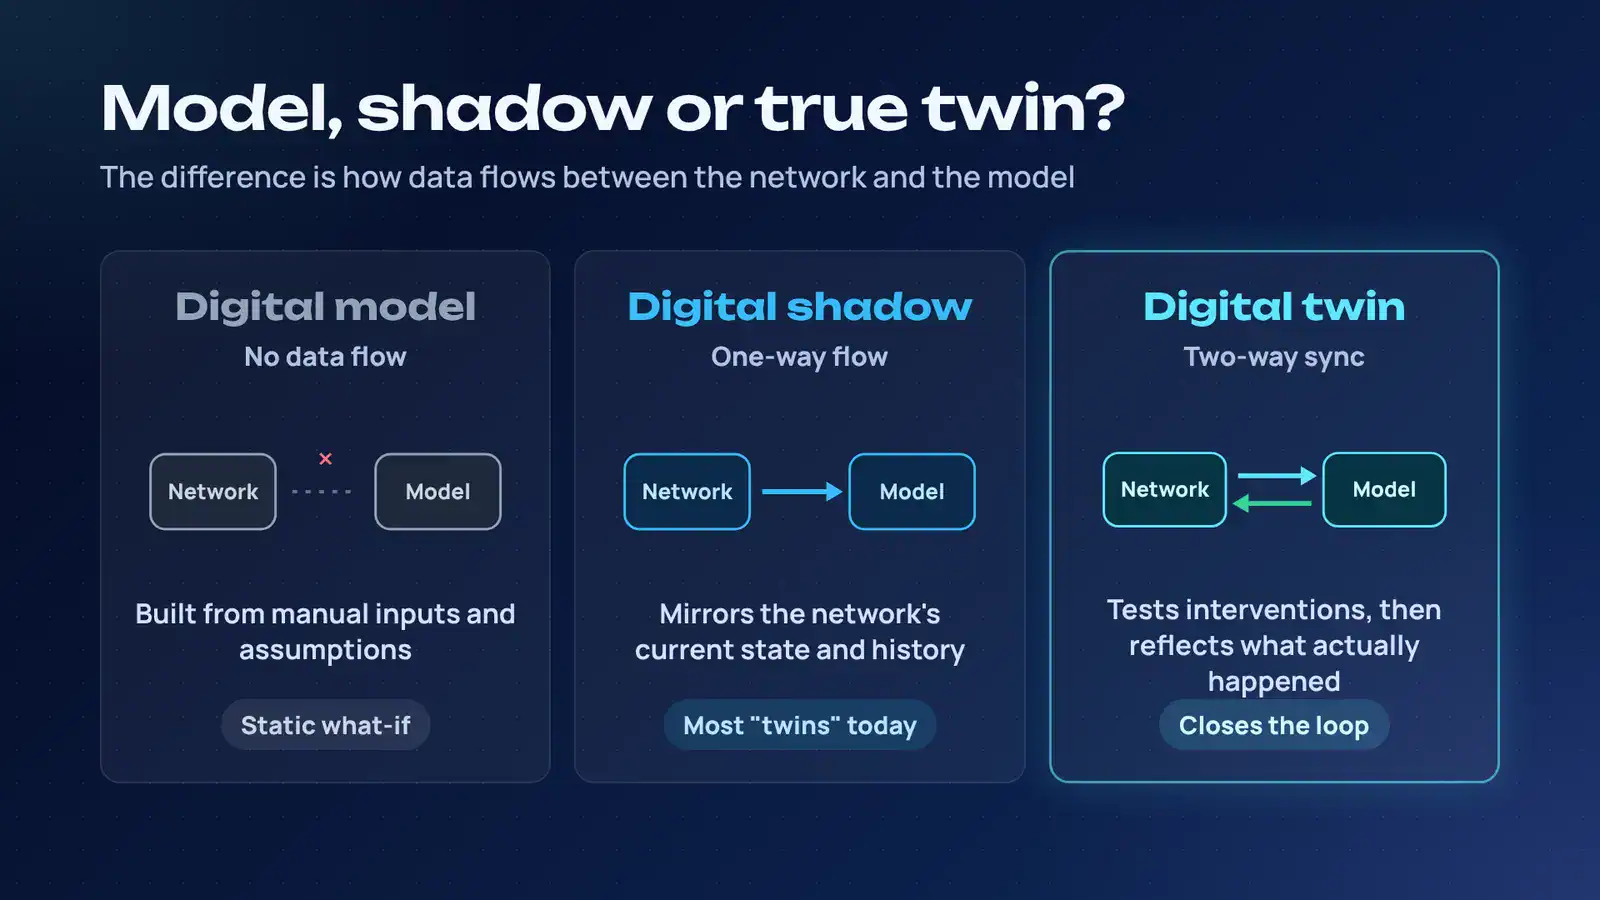
A supply chain digital twin is a virtual representation of a physical supply chain, facility, or process that uses operational data to mirror current conditions. When it is connected to simulation tools, teams can test scenarios involving inventory, capacity, lead times, and transportation flows. Coupa’s guide describes it as a model that pulls near-real-time data from sources such as ERP systems, factory outputs, inventory levels, vehicle locations, and shipment schedules to give an end-to-end view of the network.
The word that matters most in that definition is connected. Precision here separates a real twin from a rebranded diagram.
The three levels: digital model, digital shadow, digital twin
| Level | Data flow | What it can do |
|---|---|---|
| Digital model | None. Built from manual inputs and assumptions | Answers “what if” with static data |
| Digital shadow | One way: the physical network updates the model | Mirrors the network’s current state and history |
| Digital twin | Bidirectional synchronization: the model informs decisions, and executed decisions flow back | Tests interventions, then reflects what actually happened |
Most “digital twins” on the market today are really digital shadows. They reflect reality but don’t close the loop. That’s still valuable, but if a vendor promises a twin, ask where the bidirectional synchronization happens. Is it an automated feed, a human-approved workflow, or nothing at all?
How Is a Digital Twin Different from a Simulation or a Dashboard?
Three tools often get lumped together, and each answers a different question.
| Tool | Core question | Data freshness | Limitation |
|---|---|---|---|
| Dashboard / control tower | “Where is everything right now?” | Live | Shows state, but a human must translate it into a decision |
| Standalone simulation | “What happens if…?” | Whatever you loaded, often a snapshot | Needs heavy manual data prep, so it goes stale quickly |
| Digital twin | “What happens if… given today’s network, and what should we do?” | Continuously refreshed | Only as good as its data, calibration, and governance |
SCMR’s October 2026 analysis frames the distinction as visualization versus simulation: a control tower dashboard is valuable, but it still requires a human to turn what they see into a decision. A true twin has enough fidelity in its constraints (capacity, lead times, contractual minimums, transportation lanes) to run a scenario and return a defensible answer, such as the added days and cost of rerouting through an alternate port versus holding at the current one.
Coupa makes a related point about spreadsheets, which many teams still use for planning. You can usually run one scenario at a time, you have to email files around for review, and the inputs may be weeks old. A twin lets leaders stress-test several scenarios in parallel against current data.
The categories also overlap. A control tower can incorporate a twin, and a twin can feed a control tower. The question to ask isn’t “which one?” but “which question am I trying to answer?”
Why the Pressure Is Rising
Disruption is no longer the exception. BCG’s research on industrial supply chains lists a run of recent shocks: the 2021 Suez Canal blockage, low water levels in the Panama Canal in 2024, rerouting away from the Red Sea, geopolitical turmoil, and persistent microchip shortages. On top of those black swan events sits what BCG calls “normal” volatility, the daily ripple of demand uncertainty, shifting production output, and supply delays.
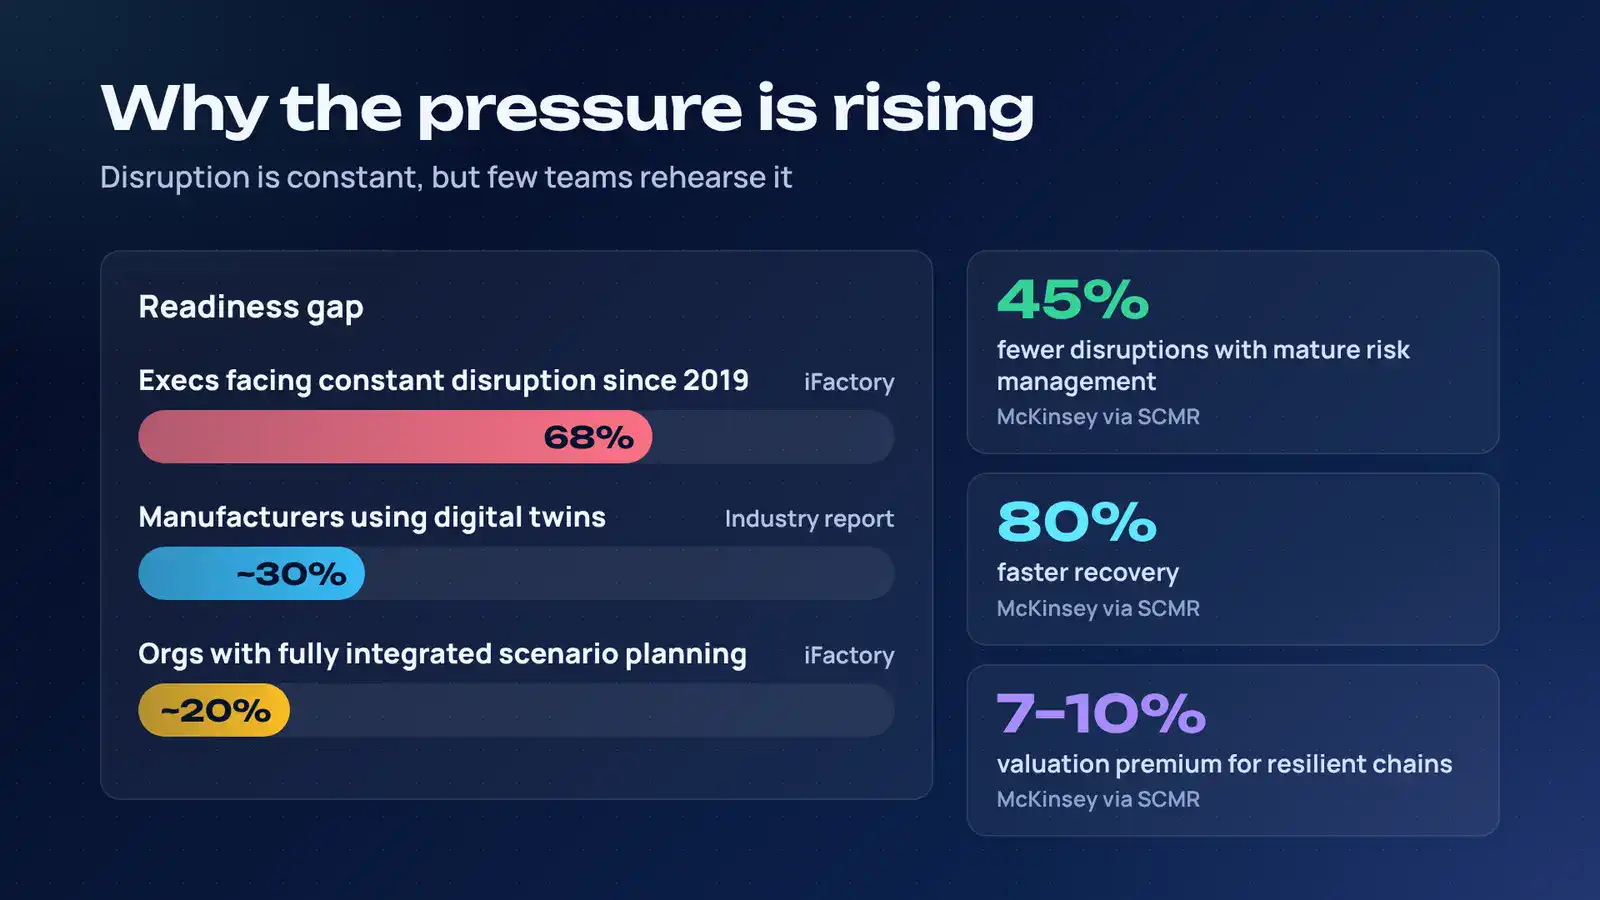
Vendor-reported figures tell a similar story. iFactory’s digital twin research page cites that 68% of supply chain executives report facing disruptive events constantly since 2019, yet only about 2 in 10 organizations have fully integrated scenario planning into their supply chain strategy. (Treat those as directional, since they come from a vendor page, but the gap they describe matches what practitioners report.)
The payoff for getting resilience right is measurable. A synthesis published by SCMR cites McKinsey research indicating that companies with mature supply chain risk management capabilities experience 45% fewer disruptions and recover 80% faster, and that resilient supply chains trade at premiums of 7% to 10% over industry averages.
Three forces also made twins practical rather than aspirational, according to SCMR’s authors:
- Data foundations caught up. Cloud ERP, integrated planning suites, and IoT-connected assets now feed models continuously rather than through a nightly batch.
- Generative AI lowered the barrier. A planner can describe a scenario in plain language rather than needing a simulation specialist to code it.
- Agentic AI is emerging. Some deployments can propose, or even execute, a response within pre-approved limits.
Adoption is real but uneven. One resilience-focused industry report estimates that nearly 30% of global manufacturers use digital twins to improve efficiency and respond to disruptions, and SCMR notes most organizations are still further along in piloting than in running twins as production infrastructure.
Under the Hood: How a Twin Simulates a Disruption
You don’t need to be a modeler to commission a twin, but you do need to know what’s inside, because the choice of technique shapes what questions the twin can answer credibly.
Network topology. The skeleton: suppliers, plants, warehouses, ports, lanes, and customers, with the relationships between them. Get this wrong and every downstream result is wrong.
Parameters and constraints. Lead time distributions (not single-point averages), capacity constraints, minimum order quantities, contractual commitments, and inventory policies (reorder points, safety stock rules, allocation logic).
Simulation engines. Different questions call for different methods:
| Technique | Best for | Example question |
|---|---|---|
| Discrete event simulation | Flows, queues, and bottlenecks in a process | “How does a 10-day dock delay propagate through our cross-dock?” |
| Agent-based modeling | Networks where independent actors make their own decisions | “How do competing customers and suppliers react when capacity tightens?” |
| Monte Carlo simulation | Quantifying uncertainty by running thousands of randomized trials | “What’s the probability we breach our service level if lead times vary this much?” |
| Optimization | Finding the best response under constraints | “Which reroute minimizes cost while meeting delivery windows?” |
Mature twins often combine them. Monte Carlo runs wrap around a discrete event model to produce a distribution of outcomes rather than a single number. That distinction matters, and we return to it in the credibility section.
What Data Does a Supply Chain Digital Twin Require?
The honest answer is “less than you fear to start, more than you have to scale.” SCMR is blunt about the most common failure mode: fragmented systems that don’t agree on a single version of inventory or lead-time truth.
Most pilots need five data families:
- Master data: Locations, products, bills of materials, supplier relationships, and contracts.
- Transactional data: Orders, shipments, receipts, and production history, usually from ERP, WMS, and TMS.
- Inventory positions: On-hand, in-transit, and allocated stock across nodes.
- Capacity and constraint data: Plant and warehouse throughput, carrier lane capacity, and supplier limits.
- External signals: Port status, weather, commodity and freight indices, and supplier risk feeds. BCG’s approach, for instance, combines internal demand and supply performance with external data such as port utilization and shipping volumes.
Two governance concepts deserve early attention. Data lineage, knowing where each number came from and how it was transformed, lets you debug a surprising result. Without it, a twin becomes a black box. Refresh cadence determines whether you have a twin or a stale model: iFactory’s research notes that stale inventory counts produce “confident-looking numbers that are quietly wrong.”
Interactive checklist: is your data twin-ready?
Count how many you can answer “yes” to for one product family or one facility (not the whole enterprise):
- Inventory by location is trusted and updated at least daily.
- Lead times are recorded as actuals, not just master-data defaults.
- We can name the single owner of supplier master data.
- Capacity limits for key nodes are documented, not tribal knowledge.
- Orders and shipments can be tied together in one system or joined reliably.
- We know which external feeds (port, weather, freight) would matter most.
5–6 yes: You can start a pilot now. 3–4: Start, but budget time for data cleanup in the first phase. 0–2: Fix inventory and lead-time data first. A twin will only magnify the confusion.
Three Disruptions Worth Simulating First
Each scenario below follows the same logic: build a baseline, inject the disruption, and compare interventions against that baseline. (The numbers are illustrative, to show how the comparison works, not benchmarks.)
1. Supplier outage
A single-source supplier stops shipping, whether through bankruptcy, a fire, or a quality hold. The twin traces which downstream lines run out of material first, and when.
How to simulate it: Set the affected node, severity (partial to total shutdown), and duration. The twin shows days of cover by SKU and the point of first stockout. Then test interventions: expedite from a secondary supplier, reallocate scarce inventory to higher-margin orders, or pull forward production of the affected component’s substitutes.
This is also where multi-tier visibility pays off. iFactory describes cascade scenarios in which a failure two or three tiers upstream, in a component nobody was tracking closely, eventually halts final assembly.
2. Port closure
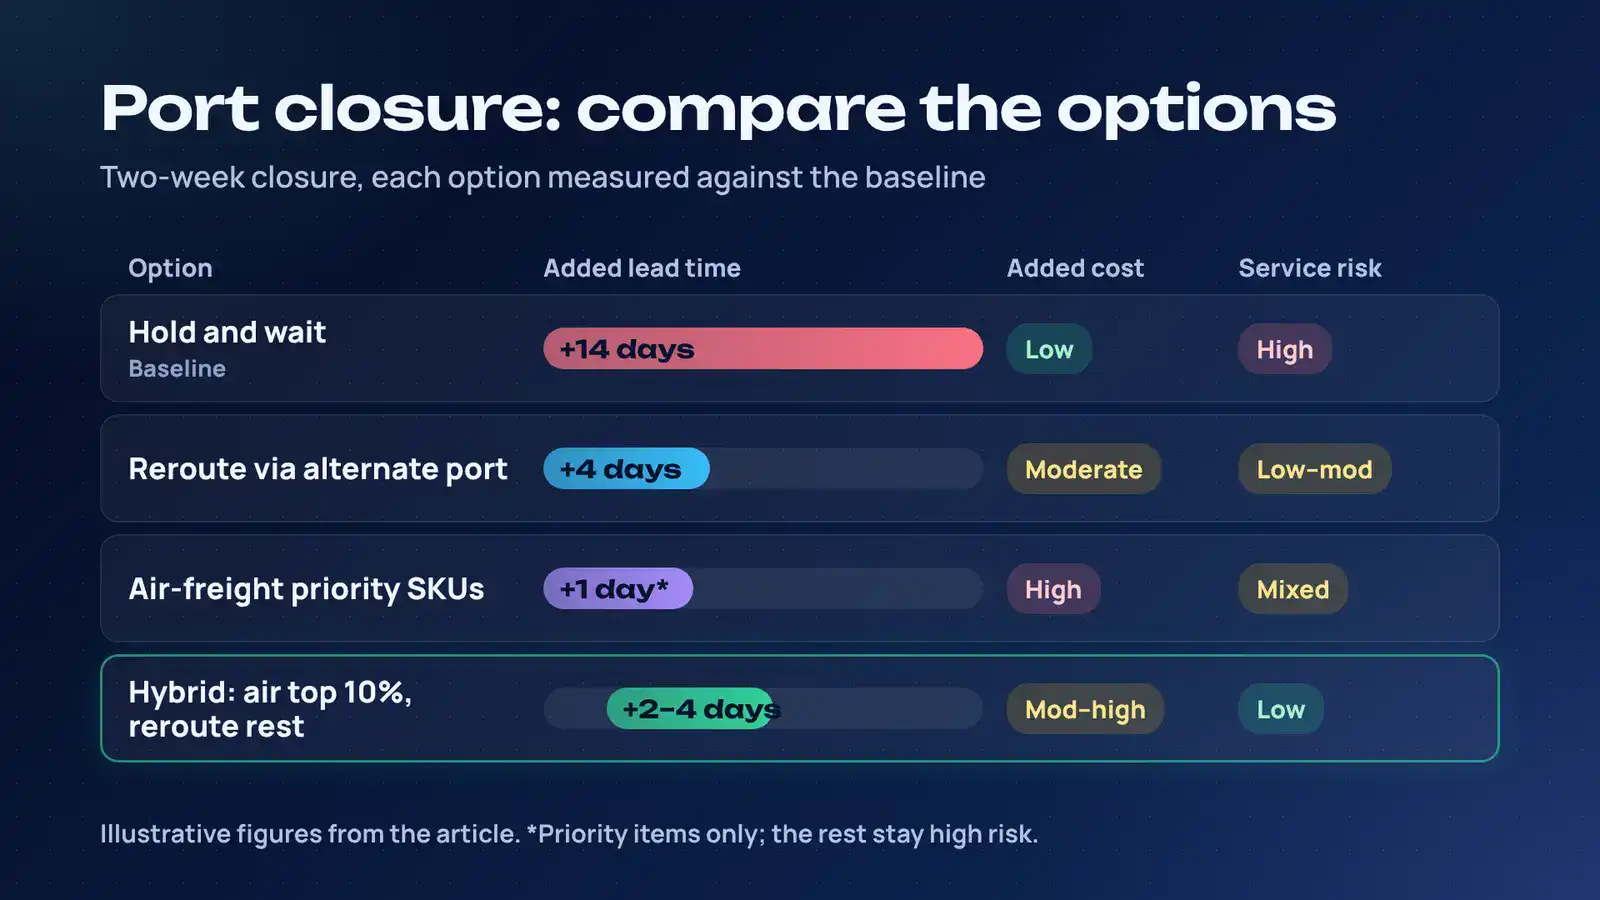
A major port closes for two weeks. Which lanes are affected? Which shipments are in transit? What’s the cost and time impact of each alternate route?
| Option (illustrative) | Added lead time | Added cost | Service-level risk |
|---|---|---|---|
| Baseline: hold and wait | +14 days | Low | High |
| Reroute via alternate port | +4 days | Moderate | Low–moderate |
| Air-freight priority SKUs only | +1 day (priority items) | High | Low (priority), high (rest) |
| Hybrid: air for top 10% of SKUs, reroute the rest | +2 to 4 days | Moderate–high | Low |
The point isn’t that the hybrid is always best. It’s that a defensible comparison takes minutes rather than the days a manual re-planning exercise needs. SCMR gives a similar example: a logistics team modeling a port closure against every active lane in minutes.
3. Demand shock
Demand for one product line jumps 40%, or collapses in one region. The twin shows where production, inventory, and transportation buckle first, and which stores or customers get shorted.
How to simulate it: Layer the demand change onto current inventory and production schedules. Because demand is uncertain, run Monte Carlo trials across a range of spike sizes rather than a single guess.
The discipline that makes it decision-grade: compare against a baseline
Every scenario needs a documented baseline, the “do nothing” or “current policy” run. Without it you can’t tell whether an intervention helps. Report results as differences from baseline across the metrics leadership cares about: service levels, total landed cost, inventory position, and recovery time (how long until performance returns to normal).
Can You Trust the Model? Calibration, Validation, and Uncertainty
This is where many programs quietly fail. A beautiful simulation that nobody trusts won’t influence a single decision, and one that’s trusted without cause is worse.
Calibration means tuning model parameters so the twin reproduces known history. Feed it last year’s actual demand and disruptions, and see whether it generates the outcomes you really experienced (stockouts, delays, cost spikes).
Validation is a separate test: does the calibrated model predict a period it wasn’t tuned on? SCMR’s authors emphasize that leaders need to compare simulated results against actual performance and understand the model’s limitations before relying on its recommendations. iFactory’s phased approach similarly suggests running initial scenarios and validating results against known history.
Sensitivity analysis reveals which inputs drive results. If your conclusion flips when one lead-time assumption moves 10%, that input needs better data or a wider confidence range.
Uncertainty quantification keeps you honest. Instead of “we’ll stock out on day 9,” a credible twin says “there’s a 70% probability of stockout between days 7 and 12.” Decision-makers can handle ranges. They can’t handle false precision.
Model drift is what happens after launch. Suppliers change, lanes change, and demand patterns shift, so a twin calibrated in January may be unreliable by June. Schedule recalibration and track forecast-versus-actual error like any other operational metric.
Credibility test for any vendor or internal team: “Show me a case where the twin’s prediction was wrong, and what you did about it.” If the answer is “that never happens,” walk away.
Where Does AI Add Value to the Twin?
Simulation and AI are complementary, not competing. A simulation encodes how you believe the network behaves. AI learns patterns from what actually happened and helps with the parts that are tedious, noisy, or too large for manual modeling.
Coupa’s guide outlines several roles for AI in digital twins, and they map cleanly to practical value:
| AI contribution | What it does for the twin |
|---|---|
| Data integration | Cleans, reconciles, and merges data from ERP, IoT, and market sources |
| Anomaly detection | Flags emerging problems such as a supplier’s lead times drifting upward |
| Predictive analytics | Improves demand and lead-time distributions that feed the simulation |
| Scenario generation | Suggests which scenarios are most worth testing |
| Optimization | Searches large option spaces for the best reroute or allocation |
| Automation | Handles routine actions within defined approval limits |
If you’re exploring the forecasting side, predictive analytics solutions can improve the demand and lead-time inputs feeding your scenarios. For the models themselves, machine learning services cover anomaly detection and learned lead-time distributions. And if you want the broader picture of how this fits operations, see how AI in logistics and supply chain is being applied end to end.
Where AI doesn’t help
AI can’t invent data you don’t have, and it can’t validate its own recommendations. A machine learning model trained on a calm period will be unreliable in a crisis, which is exactly when you need the twin. That’s why pairing learned components with physics-style process logic and explicit constraints (a hybrid approach) tends to be more robust than either alone.
Governance matters too. SCMR’s executive takeaways recommend setting approval thresholds, escalation rules, and accountability before granting any AI agent execution authority. Start with recommendations a human approves. Earn autonomy with evidence.
What Results Are Organizations Seeing?
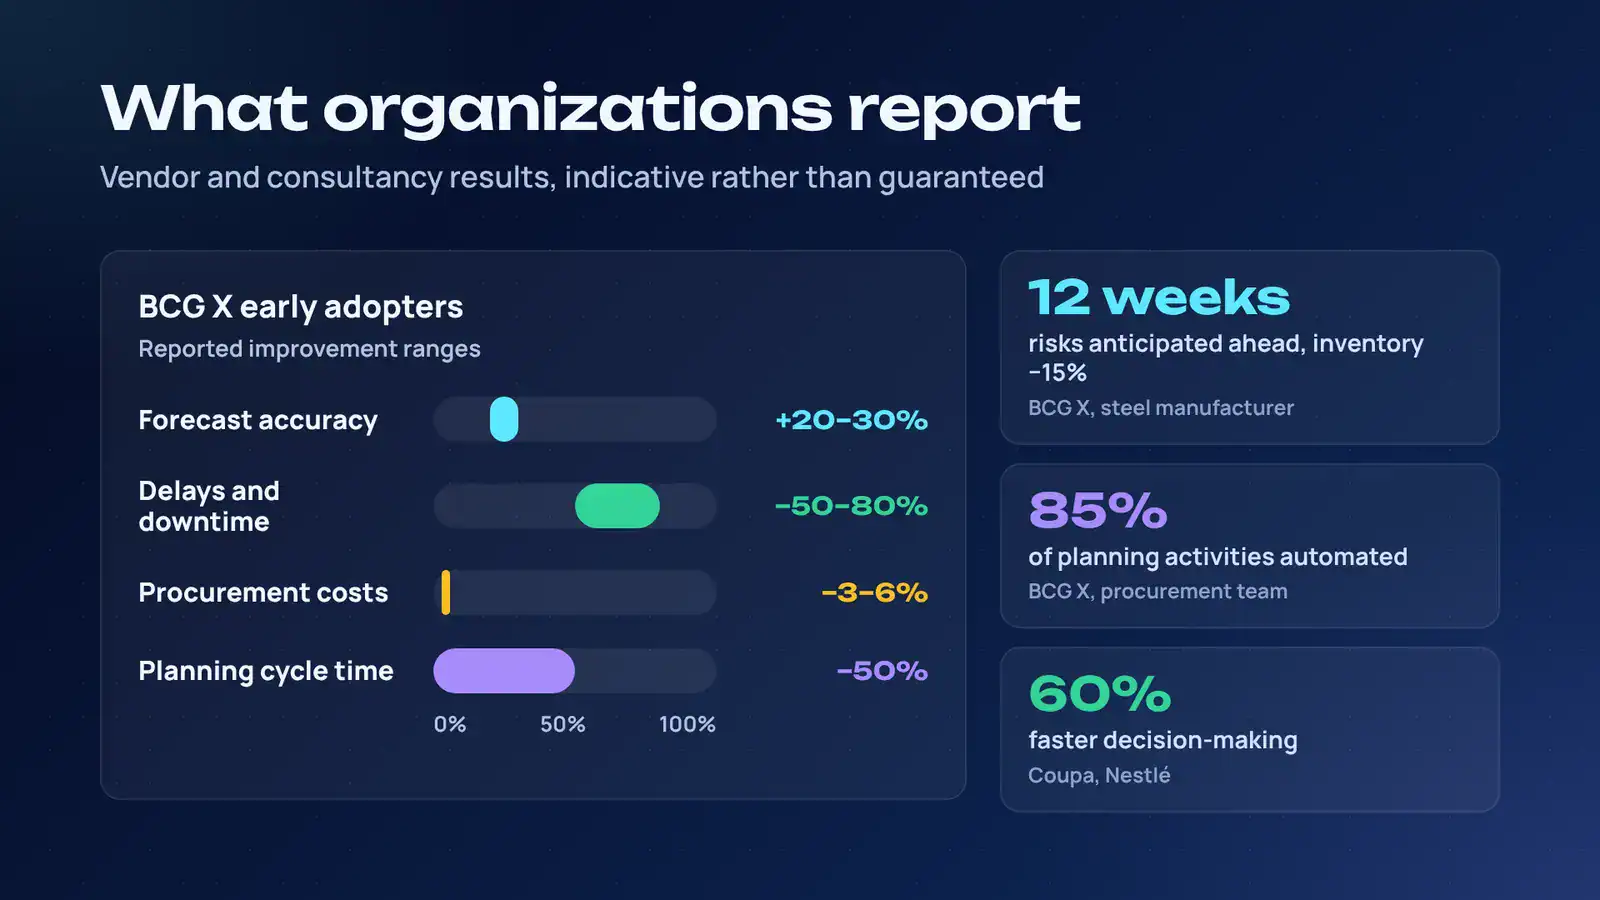
Results vary by industry and maturity, and many published figures come from vendors or consultancies. Treat these as indicative, not guaranteed.
| Source | Reported result | Context |
|---|---|---|
| BCG X (Value Chain Digital Twin) | 20–30% improvement in forecast accuracy; 50–80% reduction in delays and downtime | Early adopters in heavy industry |
| BCG X | Cost reductions of 3–6% in procurement | Even in mature procurement organizations |
| BCG X, steel manufacturer | EBITDA up 2 percentage points; inventory down 15%; risks anticipated up to 12 weeks ahead | Network with 50 producing assets, 300+ warehouses, 20,000+ SKUs |
| BCG X, procurement team | 85% of planning activities automated; planning cycle times cut by 50% | Days-long tasks reduced to minutes |
| Coupa, Nestlé | 60% faster decision-making | Digital twin built around factory output |
| Coupa, Microsoft | Carbon emissions integrated as a core decision metric toward a 40% footprint reduction goal | Supply chain design and logistics decisions |
One BCG detail is worth noting for implementation planning. One client deployed the twin on top of its existing SAP planning infrastructure and began seeing benefits within three months.
SCMR offers the most honest ROI framing: the real return is compressing the time between a signal and a defensible option being on the table. A twin that trims two days off a re-planning cycle during a disruption is worth more in a bad month than one that shaves half a percent off routine costs in a good one.
How Much Does a Supply Chain Digital Twin Cost?
Let’s be straightforward: there is no honest universal price. Published sources describe the cost drivers rather than a standard figure, and anyone quoting a flat number without knowing your scope is guessing. Coupa itself notes that training time, implementation workload, and maintenance costs deter some companies.
What actually moves the digital twin supply chain cost:
- Scope. One facility or lane versus a global multi-tier network is the single biggest driver.
- Data integration effort. The number of source systems, and how clean they are, often dominates the budget more than the modeling itself.
- Software approach. Buying a platform, configuring a vendor solution, or building custom. Each shifts cost between licensing and engineering.
- Modeling depth. A deterministic what-if model costs less than one with probabilistic simulation, learned components, and optimization.
- Calibration and validation. Time with domain experts to tune and test the model.
- Ongoing maintenance. Recalibration, data pipeline upkeep, and model monitoring. SCMR advises accounting for integration and maintenance costs when judging whether the twin pays off.
- People and change management. Training planners, and defining who owns the twin after the project ends.
A practical way to frame the business case: compare the twin’s total cost of ownership against (a) the cost of one avoided or shortened disruption, (b) inventory freed by right-sizing buffers, and (c) planner hours saved. iFactory’s illustration of per-SKU buffer sizing (roughly 6 days of baseline safety stock versus 14, 24, or 35+ days depending on disruption severity and sourcing risk) shows why: running the exercise per SKU replaces blanket caution with evidence.
Ask any vendor for a pilot-scoped quote with defined success metrics, rather than an enterprise price.
Your First Pilot: Start Bounded
The most common way digital twin initiatives stall, according to SCMR, is trying to model the entire global network on day one. The organizations moving fastest start with one high-value use case (a single facility, lane, or category), prove the model’s fidelity, and expand only when data and governance can support it.
A four-phase roadmap
Phase 1: Choose the decision and connect core data (weeks 1–6).
Pick a costly recurring decision: a capacity-constrained plant, a single-source category, or a disruption-prone lane. Define how better scenario testing would improve the outcome. Connect ERP, inventory, and transportation feeds for that scope only.
Phase 2: Build, calibrate, validate (weeks 6–12).
Build the topology and constraints, calibrate against history, and validate on a period the model hasn’t seen. Document known limitations.
Phase 3: Run the first scenarios (weeks 10–16).
Test a supplier failure and a demand shock. Compare interventions against the baseline and have planners challenge the results. Record where the twin was wrong.
Phase 4: Operationalize and expand (month 4 onward).
Move scenario testing into the regular planning rhythm, weekly rather than annually. Add nodes and lanes only when each new feed improves the picture. Set up recalibration and name an owner.
What to measure
SCMR recommends measuring decision speed alongside financial results. Track:
- Time to evaluate a response (hours versus days)
- Number of scenarios tested per quarter
- Forecast-versus-actual error of the twin
- Service level, inventory, and expediting cost versus baseline
- Recovery time after real disruptions
Pilot scope self-check
Before you kick off, can you answer all of these in one sentence each?
- What decision will this improve?
- Who makes that decision, and how often?
- What data does it require, and who owns it?
- How will we know the model is right enough?
- Who approves any action the twin recommends?
If any answer is “we’ll figure it out later,” tighten the scope before starting.
Rehearse the Disruption, Don’t Just React to It
A supply chain digital twin isn’t a prettier dashboard, and it isn’t a crystal ball. It’s a rehearsal space: a connected, calibrated model where you can run the port closure, the supplier outage, and the demand shock before they happen, and compare your options against a baseline with eyes open about uncertainty.
The organizations getting value share a pattern. They start from a costly decision rather than from technology. They validate before they trust. They treat the twin as a product with an owner and a roadmap. And they expand scope only when the data and governance can carry it.
If you’re weighing a pilot, start with the self-checks above. If you’d like help scoping a bounded first use case, Cubix’s AI team can walk through your network, your data readiness, and where simulation and machine learning would add the most value.
Simulate Disruptions Before They Strike. Talk to Our AI Experts Today
Contact UsFrequently Asked Questions
1. How is a supply chain digital twin different from a simulation?
A simulation tests a hypothesis using the data you load into it, and that data is often a one-time snapshot. A digital twin stays connected to operational data, so the model continuously reflects the current network and can be re-run on demand. A twin typically embeds simulation engines, but it adds live data, synchronization, and a decision workflow around them. Think of a simulation as a one-off experiment and a twin as a standing laboratory.
2. What data is needed to build a supply chain digital twin?
At minimum: master data (locations, products, suppliers), transactional history (orders, shipments, production), inventory positions, capacity and constraint information, and relevant external signals such as port status or freight indices. You don’t need enterprise-wide perfection. A pilot can start with one product line or facility where ERP and transportation data are already reliable. Good data lineage and a defined refresh cadence matter more than sheer volume.
3. Can digital twins predict supply chain disruptions?
Partly. A twin can flag early warning signs (drifting lead times, rising supplier risk, port congestion) and quantify the probability and impact of known risk types. It cannot foresee every event. As one industry source puts it, technology can’t directly predict a pandemic or labor shortage, but a twin makes organizations smarter in how they decide and respond. Its strongest value is rehearsing “what if” scenarios so your response is ready when something happens, not clairvoyance.
4. How does AI improve supply chain scenario modeling?
AI improves the inputs and the search. It cleans and integrates messy data, learns realistic lead-time and demand distributions, detects anomalies early, suggests which scenarios are worth running, and finds strong interventions across a large option space. Simulation still provides the structure that makes results explainable. The best results usually combine both, with human approval governing any action.
5. What should a first digital twin pilot include?
One bounded scope (a facility, lane, or category), one costly recurring decision, a documented baseline, calibration and validation against history, two or three disruption scenarios, clear success metrics, and a named owner. Plan for about three to four months to a first decision-grade result, though this varies with data readiness. BCG reports one client seeing benefits within three months of starting.