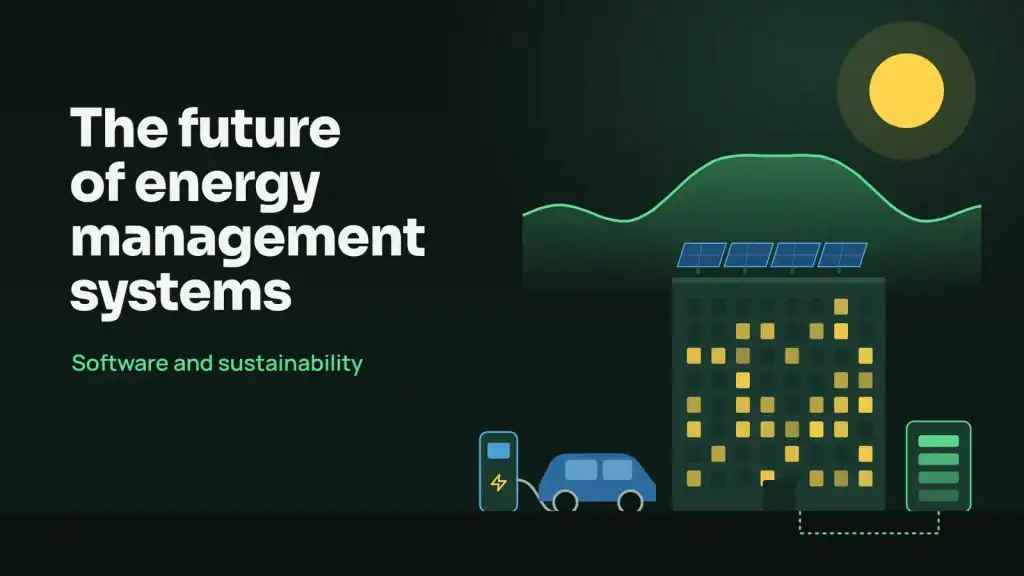
The future of energy management systems runs on software. Meters, sensors, and controllers now feed live data into platforms that track, predict, and cut energy use across homes, offices, and factories. Spending reflects that shift. The global EMS market sits at USD 66.16 billion in 2026 and is projected to reach USD 158.66 billion by 2034, more than doubling in eight years.
Three pressures drive this growth. Energy prices stay volatile, carbon reporting rules keep tightening, and buildings now host solar panels, batteries, and EV chargers that need coordination. As a result, energy management system software has moved from a simple dashboard to a core business tool.
This guide explains how EMS platforms work, which features matter, and how IoT, AI, and the cloud change what they can do. You’ll also see what it takes to build one, what it costs, and how to prove the return. If you plan to connect your own meters and sensors to a central platform, IoT software development is usually the first step.
Key Takeaways
- An EMS collects energy data, finds waste, and controls equipment to cut cost and emissions.
- Core features include real-time monitoring, analytics, fault detection, demand response, and BMS integration.
- IoT supplies the data, AI turns it into forecasts and decisions, and the cloud scales it across sites.
- Modern platforms manage solar, storage, and EV charging, not just consumption.
- Custom builds suit complex portfolios. Off-the-shelf tools fit simple, single sites.
- Every savings claim needs a verified energy baseline and a recognized M&V method.
What Is an Energy Management System?
An energy management system (EMS) combines hardware and software to measure, analyze, and control energy use. It connects meters, sensors, and equipment controllers to one platform. Then it uses that data to cut waste, lower bills, and hit climate goals.
Residential Energy Management Systems
A home energy management system (HEMS) coordinates the devices that use or produce power inside a house. Typical components include smart thermostats, smart plugs, heat pumps, rooftop solar inverters, home batteries, and EV chargers.
Here’s what a HEMS does day to day:
- Shows live and historical usage in a mobile app.
- Shifts flexible loads like EV charging and water heating to cheaper off-peak hours.
- Stores midday solar output in a battery for evening use.
- Joins utility demand response events with no manual steps.
Commercial Energy Management Systems
Commercial EMS platforms serve offices, retail chains, hotels, hospitals, and campuses. In these buildings, HVAC and lighting usually make up the largest share of the bill. Because of that, the EMS works closely with the building management system that already runs those assets.
Commercial users care about a few specific outcomes:
- Tracking utility bills against tariff schedules and catching billing errors.
- Cutting demand charges by controlling peak loads.
- Comparing energy use across sites in a portfolio.
- Producing ESG and carbon reports for investors and regulators.
Industrial Energy Management Systems
Industrial EMS platforms focus on production. Motors, compressors, chillers, furnaces, and process heat dominate consumption in factories, so the system tracks energy per unit produced, not just total usage.
Typical industrial use cases include:
- Finding compressed air leaks that run around the clock.
- Running energy-heavy jobs outside peak price hours.
- Linking energy data to production data from MES and ERP systems.
- Helping the plant earn ISO 50001 certification.
Why Energy Management Software Matters for Sustainability
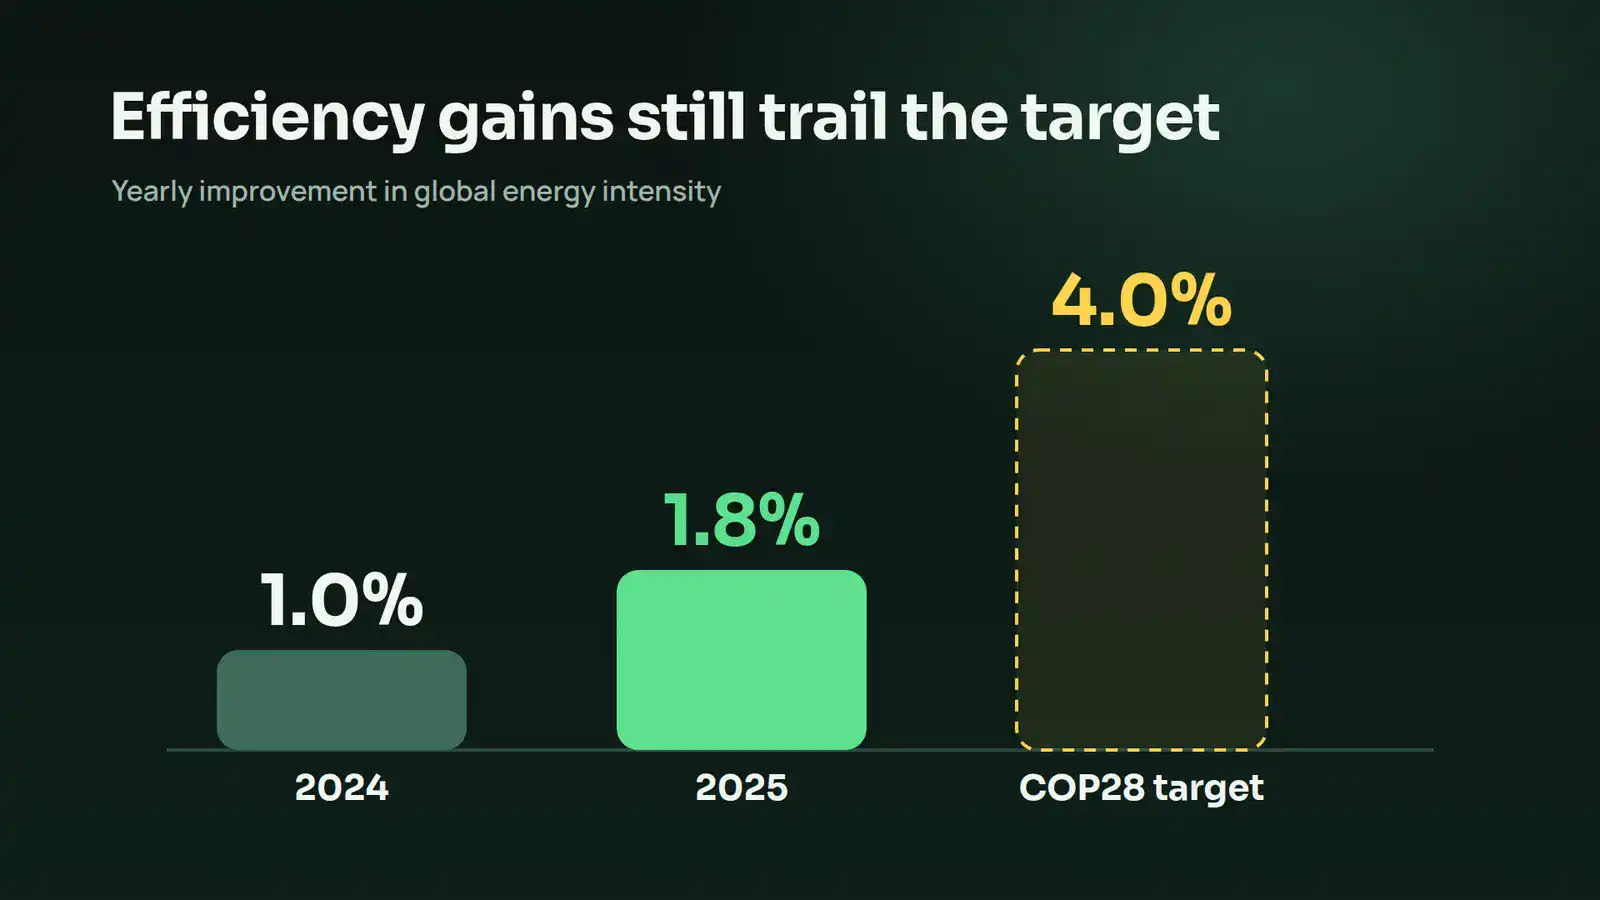
Energy efficiency is the cheapest way to cut emissions, but global progress remains slow. According to the IEA, global energy intensity improved by 1.8% in 2025, up from 1% in 2024, yet that still falls well short of the 4% annual target agreed at COP28. Software helps close that gap because it shows where energy goes and acts on it automatically.
From Energy Monitoring to Decarbonization
Basic energy monitoring software answers one question: how much energy did we use? That’s useful, but it doesn’t cut emissions on its own. Real decarbonization needs the system to move through clear stages.
- Visibility: Meters and sensors show consumption by site, system, and asset.
- Analysis: Software finds waste, faults, and unusual patterns.
- Control: The platform adjusts setpoints, schedules, and loads.
- Optimization: Forecasts and AI pick the lowest-cost, lowest-carbon option.
- Decarbonization: Electric equipment, on-site solar, and clean power buys replace fossil fuels.
Measuring Energy Savings and Emissions
You can’t measure savings by comparing this year’s bill to last year’s. Weather, occupancy, and production change from year to year. That’s why credible programs start with energy baselines, which are models that predict what a site would have used without any changes.
Good savings measurement follows a few rules:
- Normalize the baseline for weather (heating and cooling degree days), occupancy, and output.
- Use a standard method. Measurement and verification (M&V) frameworks like IPMVP and ASHRAE Guideline 14 define how to calculate and report savings.
- Report emissions clearly. Multiply consumption by the right grid emission factor and separate location-based from market-based Scope 2 figures.
- Move toward hourly data. Hourly carbon accounting shows the real impact of shifting loads to cleaner hours.
Core Energy Management Software Features
Not every platform offers the same depth. The energy management software features below separate a basic dashboard from a system that actually cuts costs. Use them as a checklist when you evaluate vendors or plan a custom build.
Real-Time Energy Monitoring
Real-time monitoring is the foundation. The platform collects interval meter data, usually at 15-minute or 1-minute resolution, from utility meters, submeters, and current sensors on individual circuits.
From that data, the system tracks two key numbers:
- Consumption kWh: total energy used over a period, which drives the energy part of your bill.
- Peak demand kW: the highest rate of use in a billing interval, which drives demand charges.
Energy Analytics and Reporting
Raw data alone doesn’t change anything. Energy analytics platforms turn it into patterns your team can act on.
Core analytics capabilities include:
- Load profiles that show how demand rises and falls across a day, week, or season.
- Benchmarking by energy use intensity (kWh per square meter or per unit produced).
- Models that build weather-adjusted baselines.
- Anomaly detection that flags usage outside the expected range.
- Cost allocation to tenants, departments, or production lines.
Fault Detection and Diagnostics
Fault detection and diagnostics (FDD) finds equipment that wastes energy quietly. These faults rarely trigger alarms because the building still feels comfortable.
Common faults an FDD engine catches:
- Heating and cooling running at the same time in one zone.
- Stuck dampers or leaking valves.
- Schedules changed by hand and never reset.
Demand Response and Peak Load Management
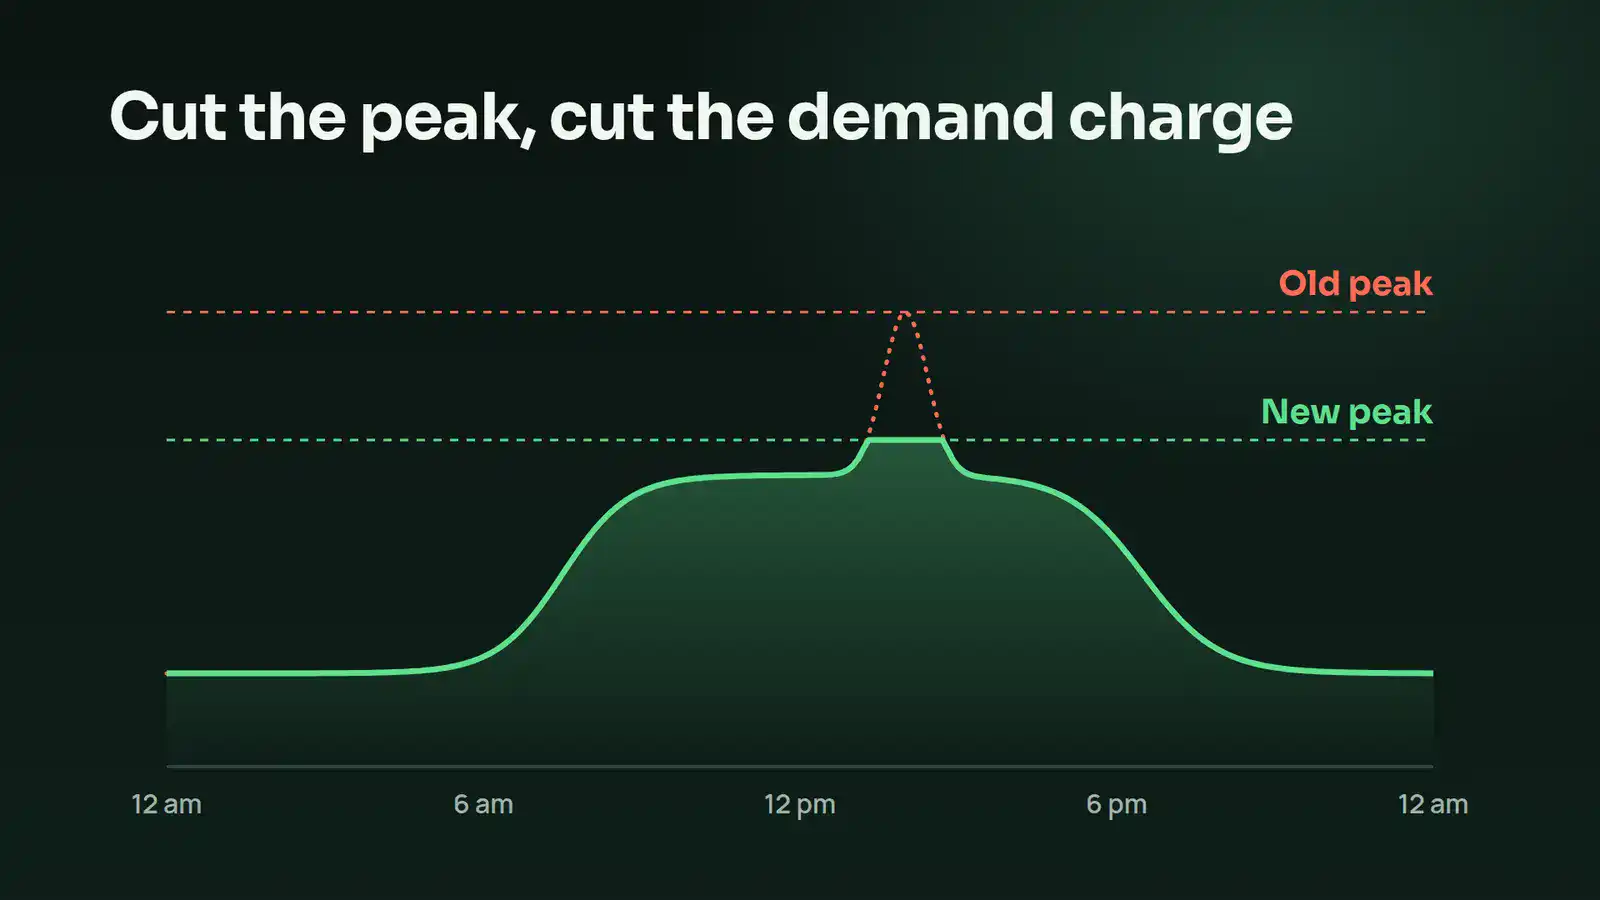
Many commercial tariffs charge for the single highest 15-minute peak in a month. A short spike sets the demand charge for the entire billing period. That makes peak control one of the fastest ways to cut costs.
An EMS manages peaks with several tactics:
- Pre-cooling buildings before the expected peak.
- Staggering start-up of large motors and chillers.
- Shedding non-critical loads for short periods.
Building Management System Integration
Most commercial buildings already have a BMS controlling HVAC, lighting, and access. Good EMS software doesn’t replace it. Instead, it reads data points from the BMS and writes back optimized setpoints and schedules.
Integration depends on common protocols:
- BACnet for HVAC and building controls.
- Modbus for meters, inverters, and industrial equipment.
- MQTT for lightweight IoT messaging.
- OPC UA for industrial automation systems.
How IoT Is Transforming Energy Management
IoT makes detailed energy data cheap to collect. According to IoT Analytics, connected IoT devices are expected to reach 21.1 billion by the end of 2025 and 39 billion by 2030. Every new smart meter, sensor, and controller adds another data point an EMS can use.
IoT Devices and Data Collection
IoT energy management relies on a layer of small, connected devices placed close to the equipment. Common examples include:
- Smart meters and submeters on main feeds and key circuits.
- Clamp-on current sensors for single machines.
- Temperature, humidity, CO2, and occupancy sensors.
- Smart plugs, thermostats, and relays for direct control.
Turning Energy Data Into Action
Data only creates value when it triggers a decision. A working EMS pipeline follows five steps:
- Collect readings from meters, sensors, and controllers.
- Clean the data by fixing gaps, duplicates, and time zone errors.
- Contextualize each reading with its site, asset, and unit.
- Analyze patterns against baselines and forecasts.
- Act through alerts, work orders, or automatic control.
The Role of AI in Energy Management
AI in energy management moves the system from reporting to prediction. Models learn how a building or plant uses energy and forecast what happens next. That lets the EMS act before costs rise, not after.
AI Applications in Energy Management
AI already handles several practical jobs inside modern platforms:
- Load forecasting: predicts tomorrow’s demand from weather, schedules, and history.
- Anomaly detection: spots unusual usage that fixed rules miss.
- Predictive maintenance: flags equipment likely to fail based on vibration, current, and runtime data.
- Baseline modeling: builds more accurate savings baselines than simple regression.
- Tariff optimization: picks the cheapest time to run flexible loads.
- Natural language queries: lets managers ask “Which site used the most energy last week?” and get an answer instantly.
AI-Driven Energy Optimization
Optimization goes one step further than prediction. Here, the AI decides what to do and then does it.
Two methods lead the way:
- Model predictive control (MPC) simulates the next few hours and picks the HVAC settings that cost the least while keeping comfort in range.
- Reinforcement learning improves control policies over time by learning from results.
Cloud Energy Management Systems and Scalability
Cloud energy management systems run data storage, analytics, and dashboards on remote servers. That makes it easy to add sites, users, and devices without buying new servers. As a result, many new deployments now start cloud first, with edge devices handling local control.
Cloud vs. On-Premise EMS
Each deployment model fits different needs. The table below compares the main tradeoffs.
| Factor | Cloud EMS | On-Premise EMS |
|---|---|---|
| Upfront cost | Low, subscription based | High, servers and licenses |
| Scalability | Add sites in days | Limited by local hardware |
| Maintenance | Handled by provider | Handled by your IT team |
| Latency | Depends on connection | Very low, local network |
| Data control | Stored with provider | Fully in house |
| Best fit | Multi-site portfolios | High-security or isolated sites |
Most companies end up with a hybrid. Edge controllers handle time-critical control on site, while the cloud runs analytics, AI models, and portfolio reporting. Hybrid architecture will define the future of energy management systems for multi-site operators, since it balances resilience with scale. If you build this yourself, cloud-native application design with containers and managed services keeps the platform easy to scale.
Data Security and System Interoperability
An EMS connects to physical equipment, so a breach can do more than leak data. Attackers can change setpoints or shut down systems. Treat security as a design requirement from day one.
Follow these security basics:
- Keep building networks apart from office IT.
- Encrypt all device traffic with TLS.
- Give every device its own identity and certificate.
- Grant users and tools only the access they need.
- Sign every firmware update.
- Follow the IEC 62443 standard for control system security.
Managing Distributed Energy Resources With EMS
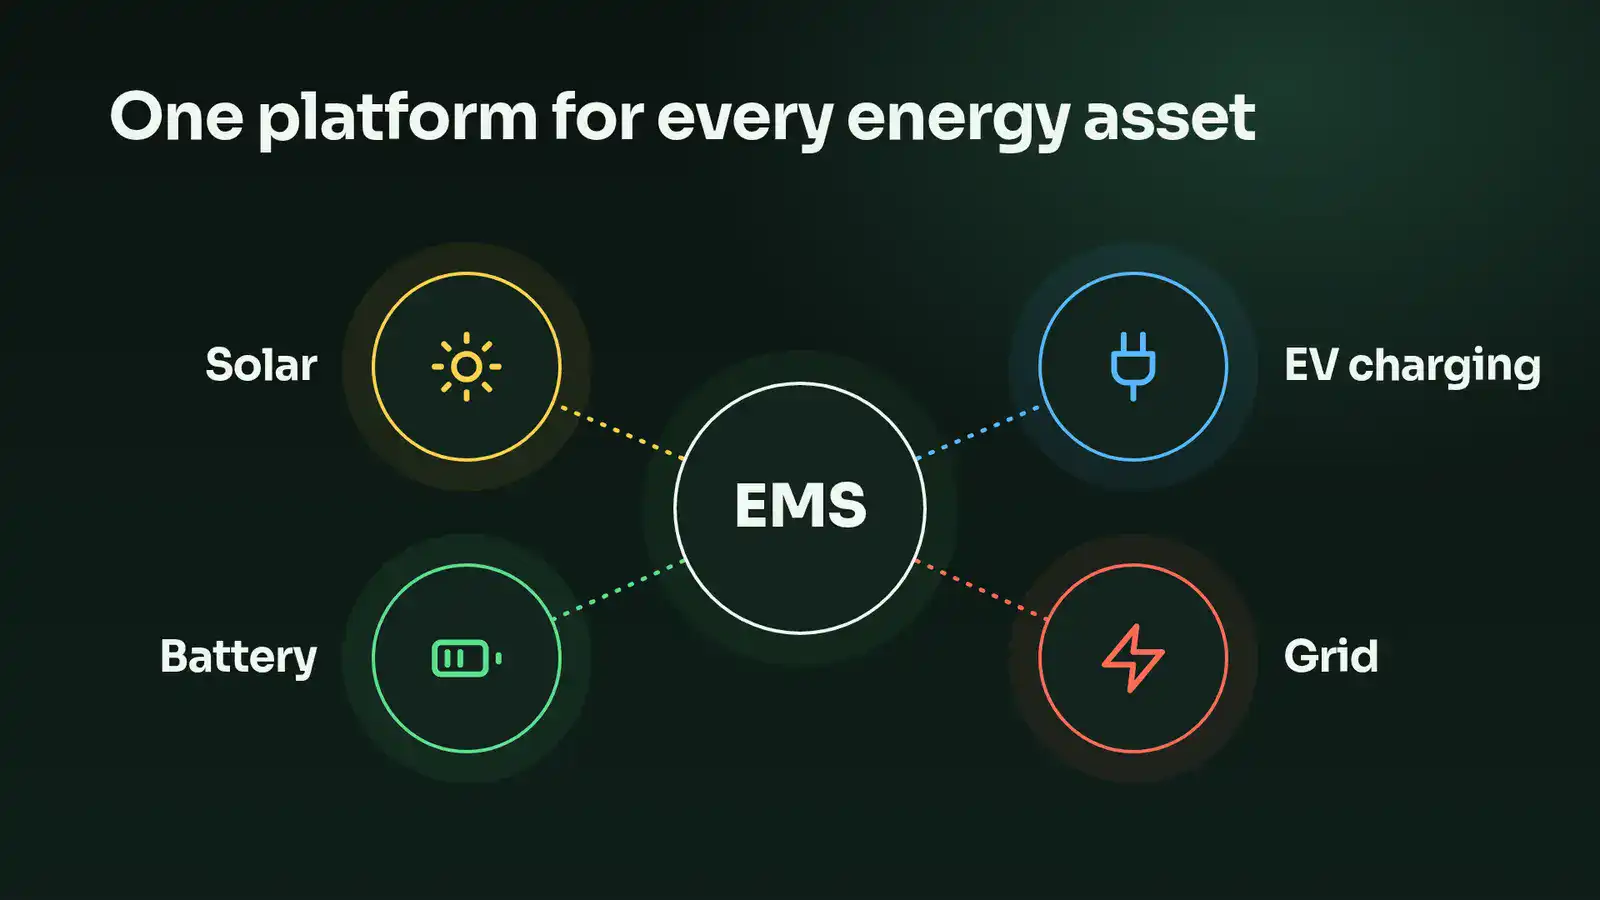
Distributed energy resources (DERs) include rooftop solar, batteries, EV chargers, and flexible loads. They turn a building from a pure consumer into a site that also produces and stores power. An EMS coordinates these assets so they work together instead of against each other.
Solar, Battery Storage, and EV Charging
Each DER brings its own control problem. Solar output changes with the weather. Batteries have limited cycles. EV chargers create sudden, large loads.
An EMS handles all three together:
- Solar: maximizes self-consumption by matching flexible loads to midday output.
- Battery storage: charges from surplus solar or cheap off-peak power, then discharges during peaks.
- EV charging: balances power across chargers so the site never exceeds its connection limit, using protocols like OCPP.
Grid Flexibility and Demand Response
Grids need more flexible demand as wind and solar grow. Utilities and aggregators now pay buildings to reduce or shift load when supply runs short.
An EMS turns your site into a flexible grid asset:
- Receives event signals through standards like OpenADR and IEEE 2030.5.
- Calculates how much load the site can shed without hurting comfort or production.
- Executes the response automatically and reports performance for payment.
Energy Management Software Development: What to Build
Energy management software development starts with data, not dashboards. You need reliable ingestion, a clean data model, and solid integrations before analytics deliver value. The sections below cover architecture, key decisions, and the build versus buy question.
Essential EMS Software Architecture
A production EMS uses a layered architecture. Each layer has one clear job.
| Layer | What It Does | Example Technologies |
|---|---|---|
| Device and edge | Reads meters and sensors, runs local control | Edge gateways, PLCs, Modbus, BACnet |
| Ingestion | Moves data from devices to the platform | MQTT brokers, Kafka, AWS IoT Core, Azure IoT Hub |
| Storage | Stores high-volume time-series readings | TimescaleDB, InfluxDB, PostgreSQL |
| Data model | Labels every point with site, asset, and unit | Project Haystack, Brick schema |
| Analytics and AI | Baselines, forecasting, FDD, optimization | Python, ML pipelines |
| Application | Dashboards, alerts, mobile apps, reports | React, Node.js, native mobile |
| Integration | Connects BMS, ERP, billing, and utility data | REST and GraphQL APIs, webhooks |
Key Software Development Considerations
Energy data brings specific engineering challenges. Plan for these early:
- Data volume: 10,000 points at 1-minute intervals produce over 14 million readings a day.
- Time handling: store everything in UTC and handle daylight saving changes correctly.
- Tariff engine: model complex time-of-use rates, demand charges, and tiered pricing.
- Offline resilience: buffer data at the edge so outages don’t create gaps.
- Multi-tenancy: separate data cleanly for each client, site, or tenant.
- Units and conversions: normalize kWh, therms, BTU, and cubic meters into one model.
- User experience: design for facility managers, not data experts.
A structured software development discovery phase helps you map these requirements, data sources, and integrations before you write any code.
Custom EMS vs. Off-the-Shelf Software
Both paths work. The right choice depends on your sites, data, and goals.
| Factor | Off-the-Shelf EMS | Custom EMS |
|---|---|---|
| Time to launch | Weeks | Months |
| Upfront cost | Lower | Higher |
| Long-term cost | Recurring per-site or per-point fees | Lower at scale |
| Integrations | Limited to supported devices | Built for your exact stack |
| Features | Fixed roadmap | Built around your workflows |
| Data ownership | Vendor controlled | Fully yours |
EMS Implementation Costs and ROI
EMS implementation costs depend on how many sites, meters, and integrations you need. A simple monitoring rollout costs far less than a platform that controls equipment across a portfolio. The key is to tie every dollar spent to a measurable saving.
Factors Affecting EMS Implementation Costs
Several factors shape the final budget:
- Scope: number of sites, meters, and data points.
- Hardware: submeters, sensors, gateways, and installation labor.
- Integrations: BMS, ERP, utility APIs, and billing systems.
- Analytics depth: basic dashboards versus FDD, forecasting, and AI optimization.
- Control features: read-only monitoring costs less than automated control.
- Hosting and security: cloud hosting, compliance, and security testing.
- Support: training, maintenance, and ongoing feature work.
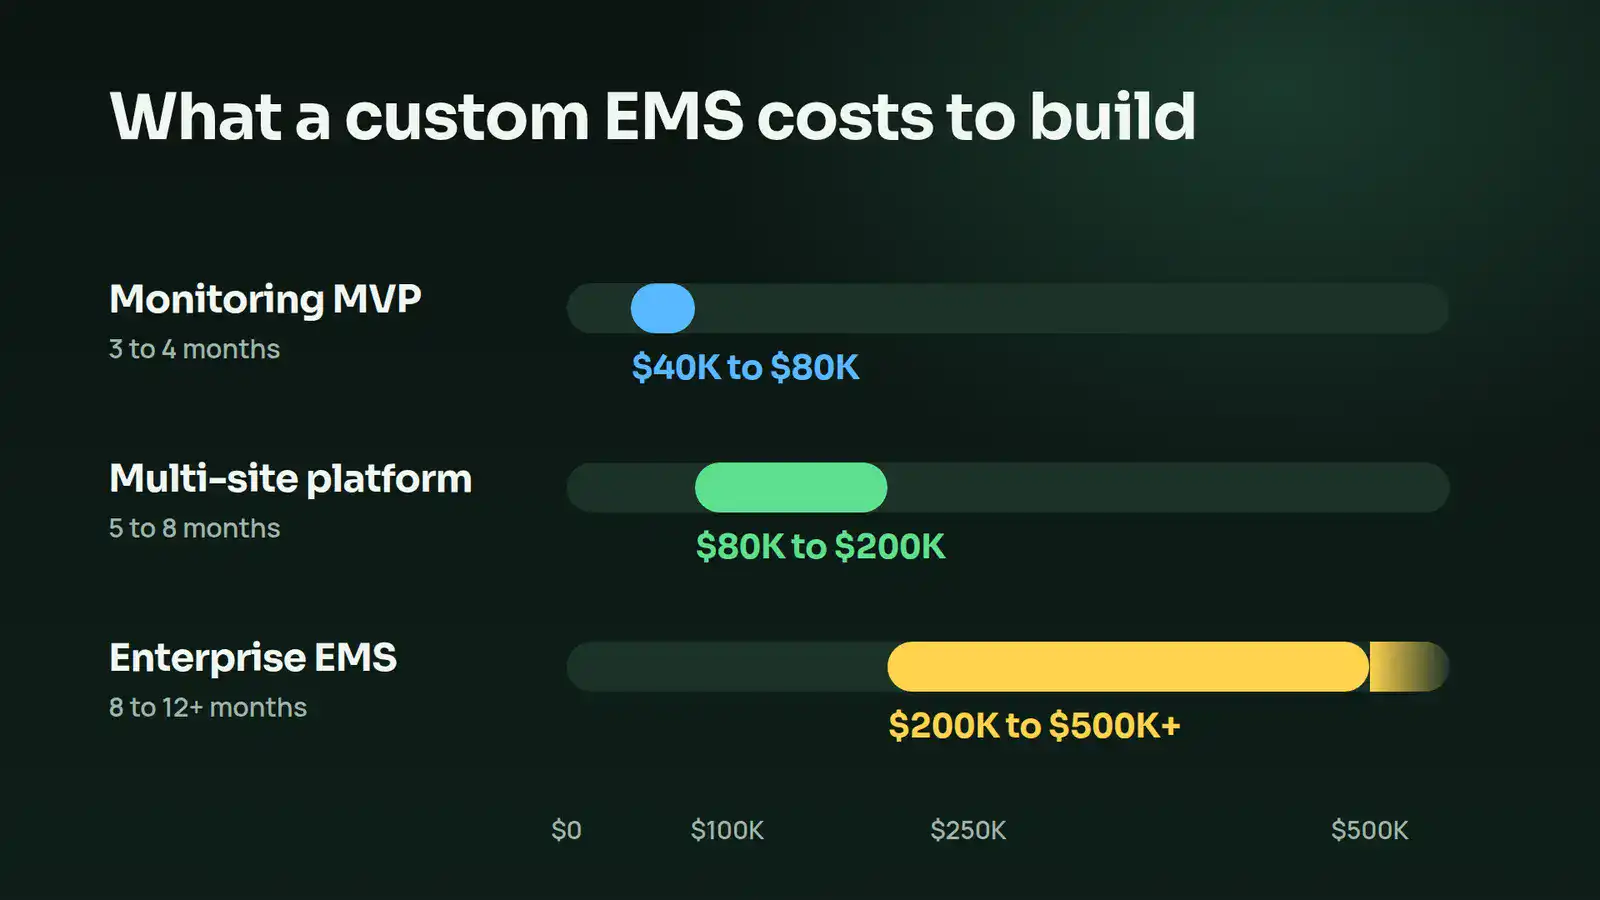
The table below shows typical ranges for custom EMS platform builds. These figures leave out meters and installation.
| Project Scope | Typical Features | Indicative Cost | Timeline |
|---|---|---|---|
| Monitoring MVP | Single site, dashboards, alerts | $40,000 to $80,000 | 3 to 4 months |
| Multi-site analytics platform | Portfolio views, FDD, reporting, BMS integration | $80,000 to $200,000 | 5 to 8 months |
| Enterprise EMS | AI optimization, DER control, demand response | $200,000 to $500,000+ | 8 to 12+ months |
Calculating EMS Return on Investment
ROI comes from more than lower energy use. Count every source of value:
- Energy savings (kWh reduction).
- Demand charge savings (kW reduction).
- Maintenance savings from early fault detection.
- Demand response and VPP payments.
- Utility rebates and incentives.
Then apply two simple formulas:
- Payback period = total project cost ÷ annual savings
- ROI = (total savings over the period minus total cost) ÷ total cost × 100
The same logic applies to any software investment, as covered in our guide on the ROI of custom software development.
Future Trends in Energy Management Systems
The future of energy management systems points toward platforms that predict, decide, and act with less manual input. Four trends stand out as we head into 2027. Each one changes what you should expect from an EMS and what you should build into it.
Predictive and Autonomous Energy Management
EMS platforms are moving from alerts to action. Instead of telling an operator that a chiller runs inefficiently, the system adjusts the chiller itself.
Digital twins speed up this shift. A digital twin is a live virtual model of a building or plant. Engineers test control strategies on the twin first, then push the winning strategy to real equipment. As a result, buildings tune themselves continuously while humans set goals and limits.
AI Agents and Automated Energy Decisions
AI agents take automation further. An agent doesn’t just predict. It completes multistep tasks across different tools.
In an EMS, an agent can:
- Read tomorrow’s weather, tariff, and occupancy data.
- Build an optimal schedule for HVAC, batteries, and EV charging.
- Open a work order when it finds a fault.
- Draft the monthly energy and carbon report.
This pattern already shows up in other industries, as our breakdown of AI agents doing real work shows.
Plug-and-Play Integration Standards
Integration has always been the slowest part of any EMS project. New standards now cut that time sharply.
Standards to watch:
- Matter for residential devices.
- ASHRAE 223P and Brick for semantic building data.
- OpenADR 3.0 for demand response signals.
- IEEE 2030.5 for DER communication with utilities.
Integrated Energy and Sustainability Management
Energy, carbon, water, and ESG reporting used to live in separate tools. Now they’re merging into one platform.
That integration brings clear benefits:
- One source of truth for energy and emissions data.
- Hourly carbon accounting tied to actual grid conditions.
- Automatic links between efficiency projects and reported emissions cuts.
- Faster, audit-ready sustainability reports.
How Cubix Builds Custom Energy Management Software
Cubix builds energy platforms that connect devices, data, and business systems in one place. We’ve delivered connected software since 2008, including real-time platforms like SpotIT for parking occupancy and Tulsa Airport for live travel information. We apply the same engineering to energy data.
Integration is where most EMS projects succeed or fail. Our system integration services connect your EMS with existing BMS, ERP, CRM, and billing platforms, so energy data flows into the tools your teams already use.
Our custom API development services let you connect utility data feeds, partner systems, and customer portals securely, without vendor lock-in.
Turn your energy data into savings with Cubix software experts
Contact UsFrequently Asked Questions
1. What is the future of energy management software?
Energy management software is heading toward predictive, self-running platforms. AI forecasts demand and optimizes equipment, IoT devices supply detailed data, and cloud platforms scale across portfolios.
2. What is the difference between EMS software and a building management system?
A building management system controls equipment like HVAC, lighting, and access inside one building. An EMS focuses on energy. It collects meter data, analyzes cost and consumption, finds waste, and sends optimized setpoints back to the BMS.
3. Cloud vs on-premises energy management software: how to choose?
Choose cloud if you manage multiple sites, want lower upfront cost, and need fast scaling. Choose on-premises if you run high-security or isolated facilities that require full data control and very low latency.
4. How do you measure savings from an energy management system?
Build a weather and occupancy adjusted energy baseline that predicts usage without the EMS. Then compare actual consumption against that baseline. Follow a recognized M&V framework like IPMVP or ASHRAE Guideline 14 so the results hold up with auditors, finance teams, and utilities.
5. What affects the cost of custom EMS development?
The main factors are the number of sites and data points, required integrations, analytics and AI depth, control features, hosting, and security needs. Custom EMS builds typically range from $40,000 for a monitoring MVP to $500,000 or more for an enterprise platform with AI and DER control.
6. What does energy management software do?
Energy management software collects data from meters and sensors, shows where and when energy is used, and finds waste. It also detects equipment faults, controls loads to reduce peaks, tracks emissions, and produces reports for finance and sustainability teams.
7. Is energy monitoring the same as automatic control?
No. Monitoring shows you what happened and alerts you to problems. Automatic control acts on that data by changing setpoints, schedules, and loads without manual input. Many teams start with monitoring, then add control once they trust the data.
8. Does an energy management system need AI?
Not at the start. Rules, schedules, and dashboards deliver solid savings on their own. However, AI adds value at scale through load forecasting, anomaly detection, predictive maintenance, and automated optimization of HVAC, batteries, and EV charging.
9. What data and integrations does EMS software need?
An EMS needs interval meter data, submeter and sensor readings, utility bills, and tariff details. It also benefits from weather, occupancy, and production data. Key integrations include the BMS, ERP or MES systems, billing platforms, and utility or demand response APIs.
10. How much does implementing an EMS cost?
A custom EMS typically costs $40,000 to $80,000 for a single-site monitoring MVP, $80,000 to $200,000 for a multi-site analytics platform, and $200,000 to $500,000 or more for an enterprise system. Metering hardware and installation add to these figures.
11. How can an organization verify energy savings?
Set a normalized baseline before changes, then track actual use afterward. Apply a standard M&V method such as IPMVP, document assumptions, and review results regularly. A third-party check makes the results easier to trust for rebate programs, investors, and carbon reports.