
Key Takeaways
- Big data for business intelligence turns scattered records into one governed source that leaders can act on.
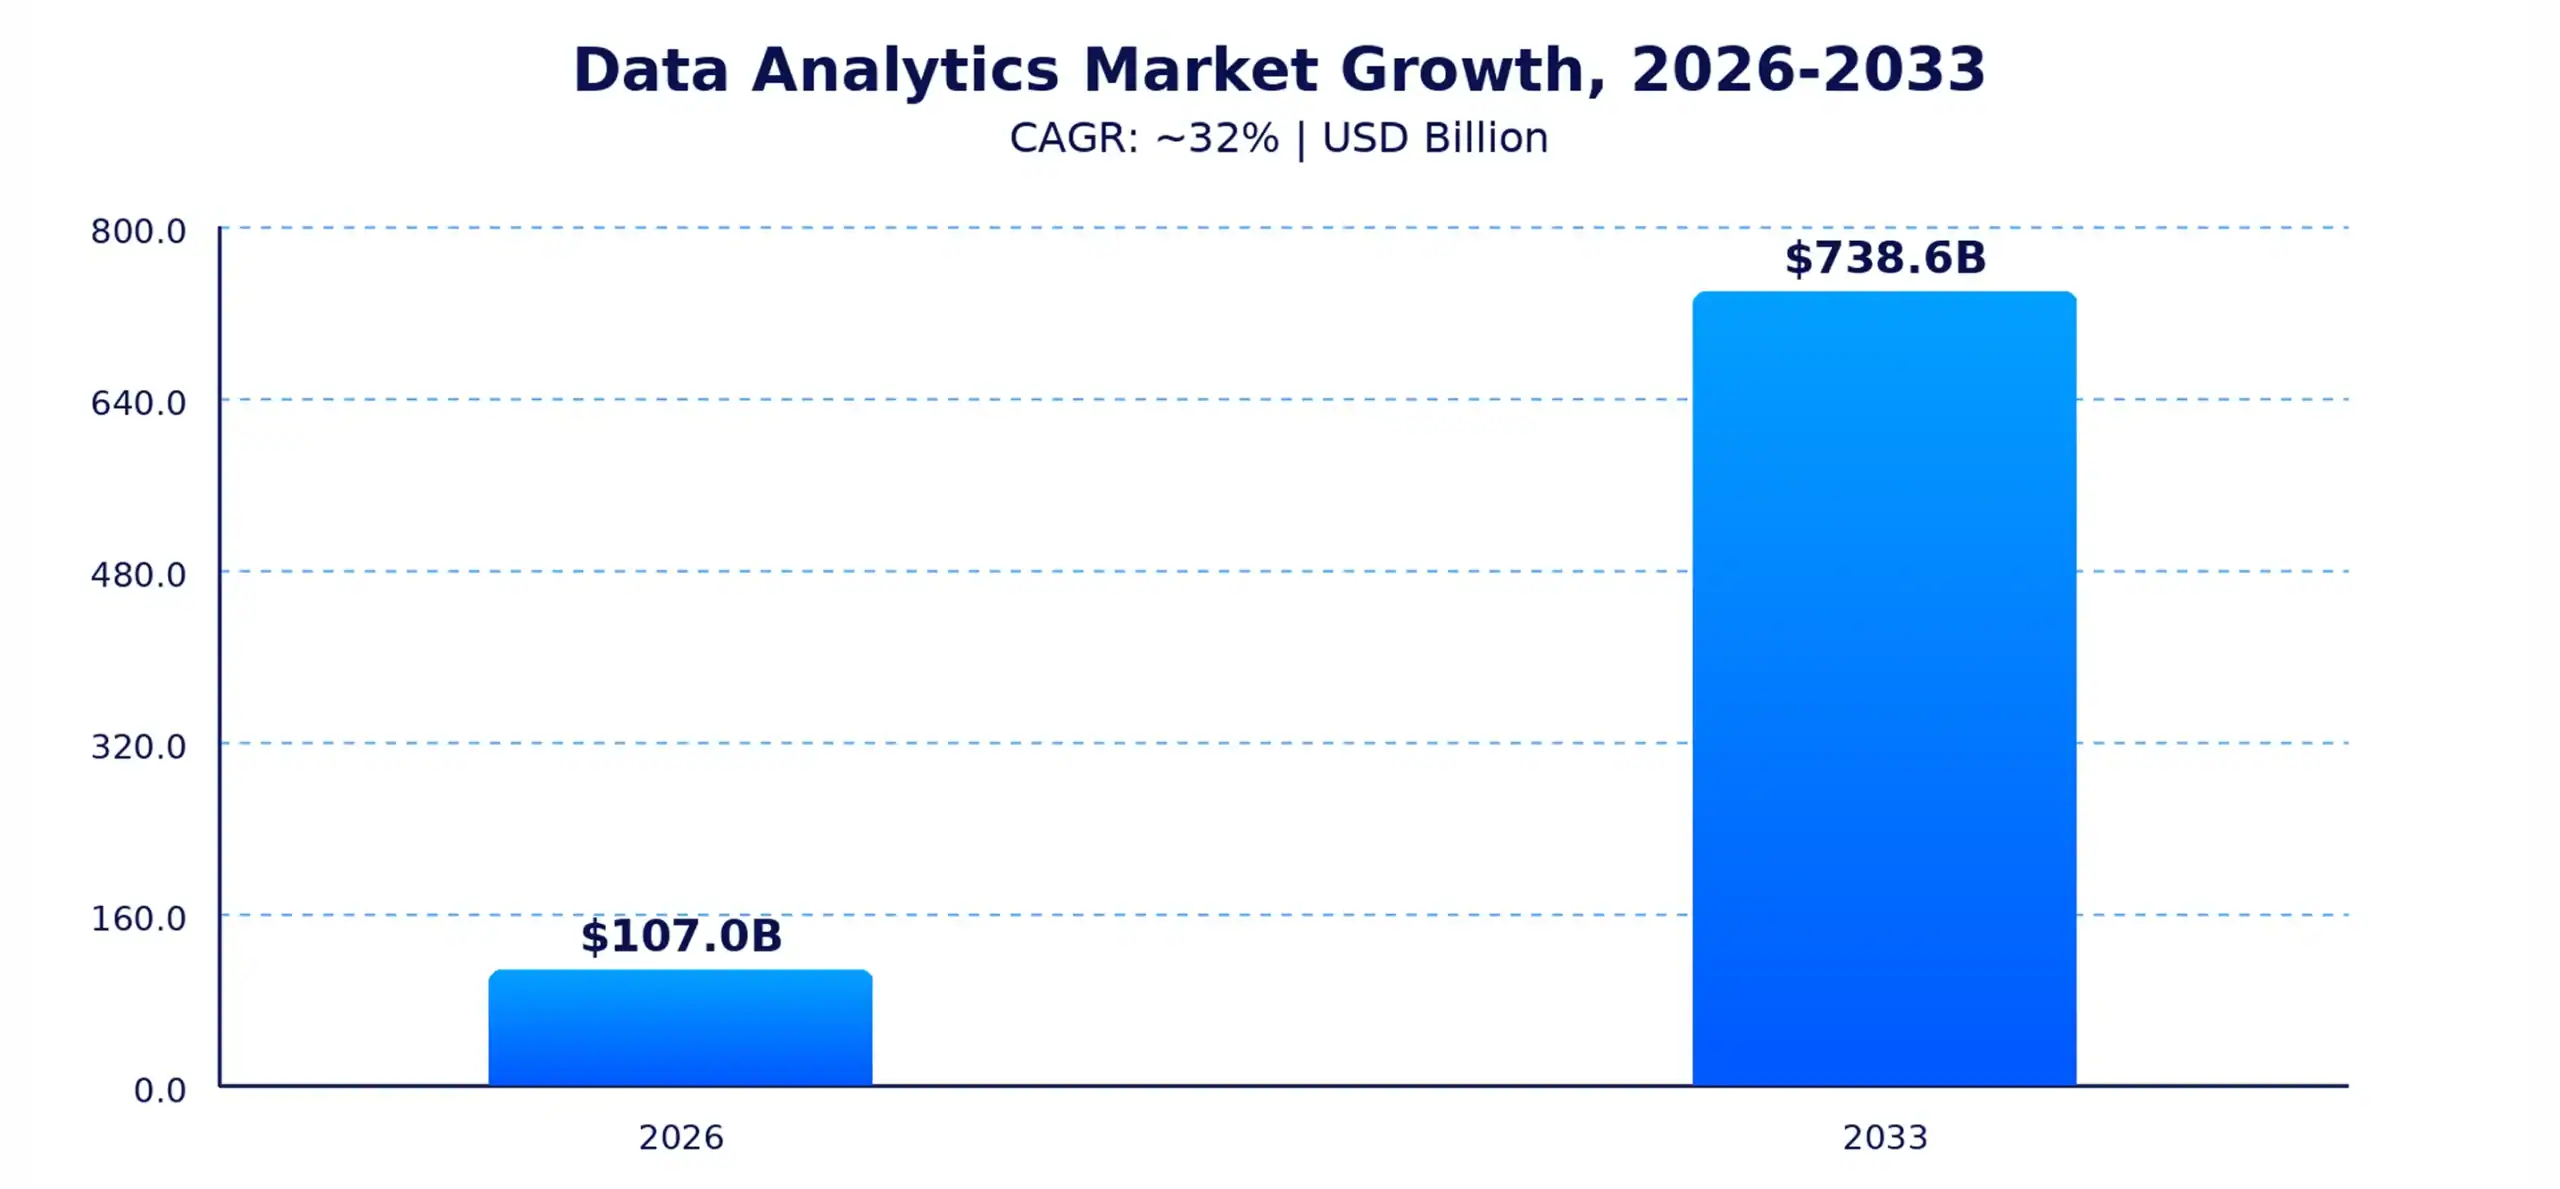
- The global data analytics market is set to grow from $107.0 billion in 2026 to $738.6 billion by 2033, so the pressure to build a real data strategy is only rising.
- Big data becomes BI through seven steps: collect, store, clean, integrate, analyze, present, and decide.
- Real-time analytics, predictive analytics, and AI-powered BI now sit at the center of how competitive companies make decisions.
- Poor data quality, silos, and weak governance remain the top reasons big data BI projects stall.
- Retail, financial services, healthcare, logistics, and SaaS all run distinct big data BI use cases with measurable returns.
- A clear strategy, strong governance, and the right BI infrastructure separate companies that scale big data BI from those that stay stuck in pilots.
Every business already sits on more data than it can read manually. The question is whether that data ever reaches a decision-maker in time to matter.
Big data for business intelligence is the practice of turning that raw, high-volume information into dashboards, forecasts, and reports people actually use. The payoff shows up in the numbers. The global business intelligence software market is expected to reach $43.71 billion in 2026, and that demand keeps climbing as companies look for platforms that convert data into action.
This guide breaks down what big data and business intelligence actually mean, how one feeds the other, and what it takes to build a system that works. You will also find the technologies, use cases, challenges, and best practices you need to plan a real strategy, not just another dashboard nobody opens.
What Is Big Data Analytics?
Big data analytics is the process of examining large, fast-moving, and varied datasets to find patterns, trends, and relationships that smaller datasets cannot reveal. It combines statistical methods, machine learning, and specialized software to process information at a scale traditional tools cannot handle.
Unlike a standard spreadsheet report, big data analytics works across structured records, free-text logs, images, video, and sensor feeds at once. As a result, it surfaces insights that would otherwise stay buried inside disconnected systems.
The growing data analytics market reflects how quickly businesses are investing in these capabilities. The global data analytics market is projected to grow from $107.0 billion in 2026 to $738.6 billion by 2033, increasing demand for systems that can turn large and complex datasets into usable business insights.
The 5 Vs of Big Data
Industry analyst Doug Laney first defined big data through three Vs, and the framework has since grown to five. Each V describes a different pressure your data systems need to handle.
| The V | What It Means | Everyday Example |
| Volume | The sheer amount of data generated and stored | A retailer logs millions of transactions every day |
| Velocity | The speed at which data is created and needs processing | Connected sensors stream readings every few seconds |
| Variety | The mix of structured, semi-structured, and unstructured formats | Database rows, support tickets, images, and video in one pipeline |
| Veracity | The accuracy and trustworthiness of the data | Removing duplicate or outdated customer records before analysis |
| Value | The business worth you extract once the data is analyzed | Turning purchase history into a personalized offer that converts |
What Is Business Intelligence?
Business intelligence, or BI, refers to the technology, processes, and practices used to collect data and turn it into insights that guide business decisions. BI sits downstream of raw data. It takes what big data analytics uncovers and presents it in a form executives, managers, and frontline teams can actually use.
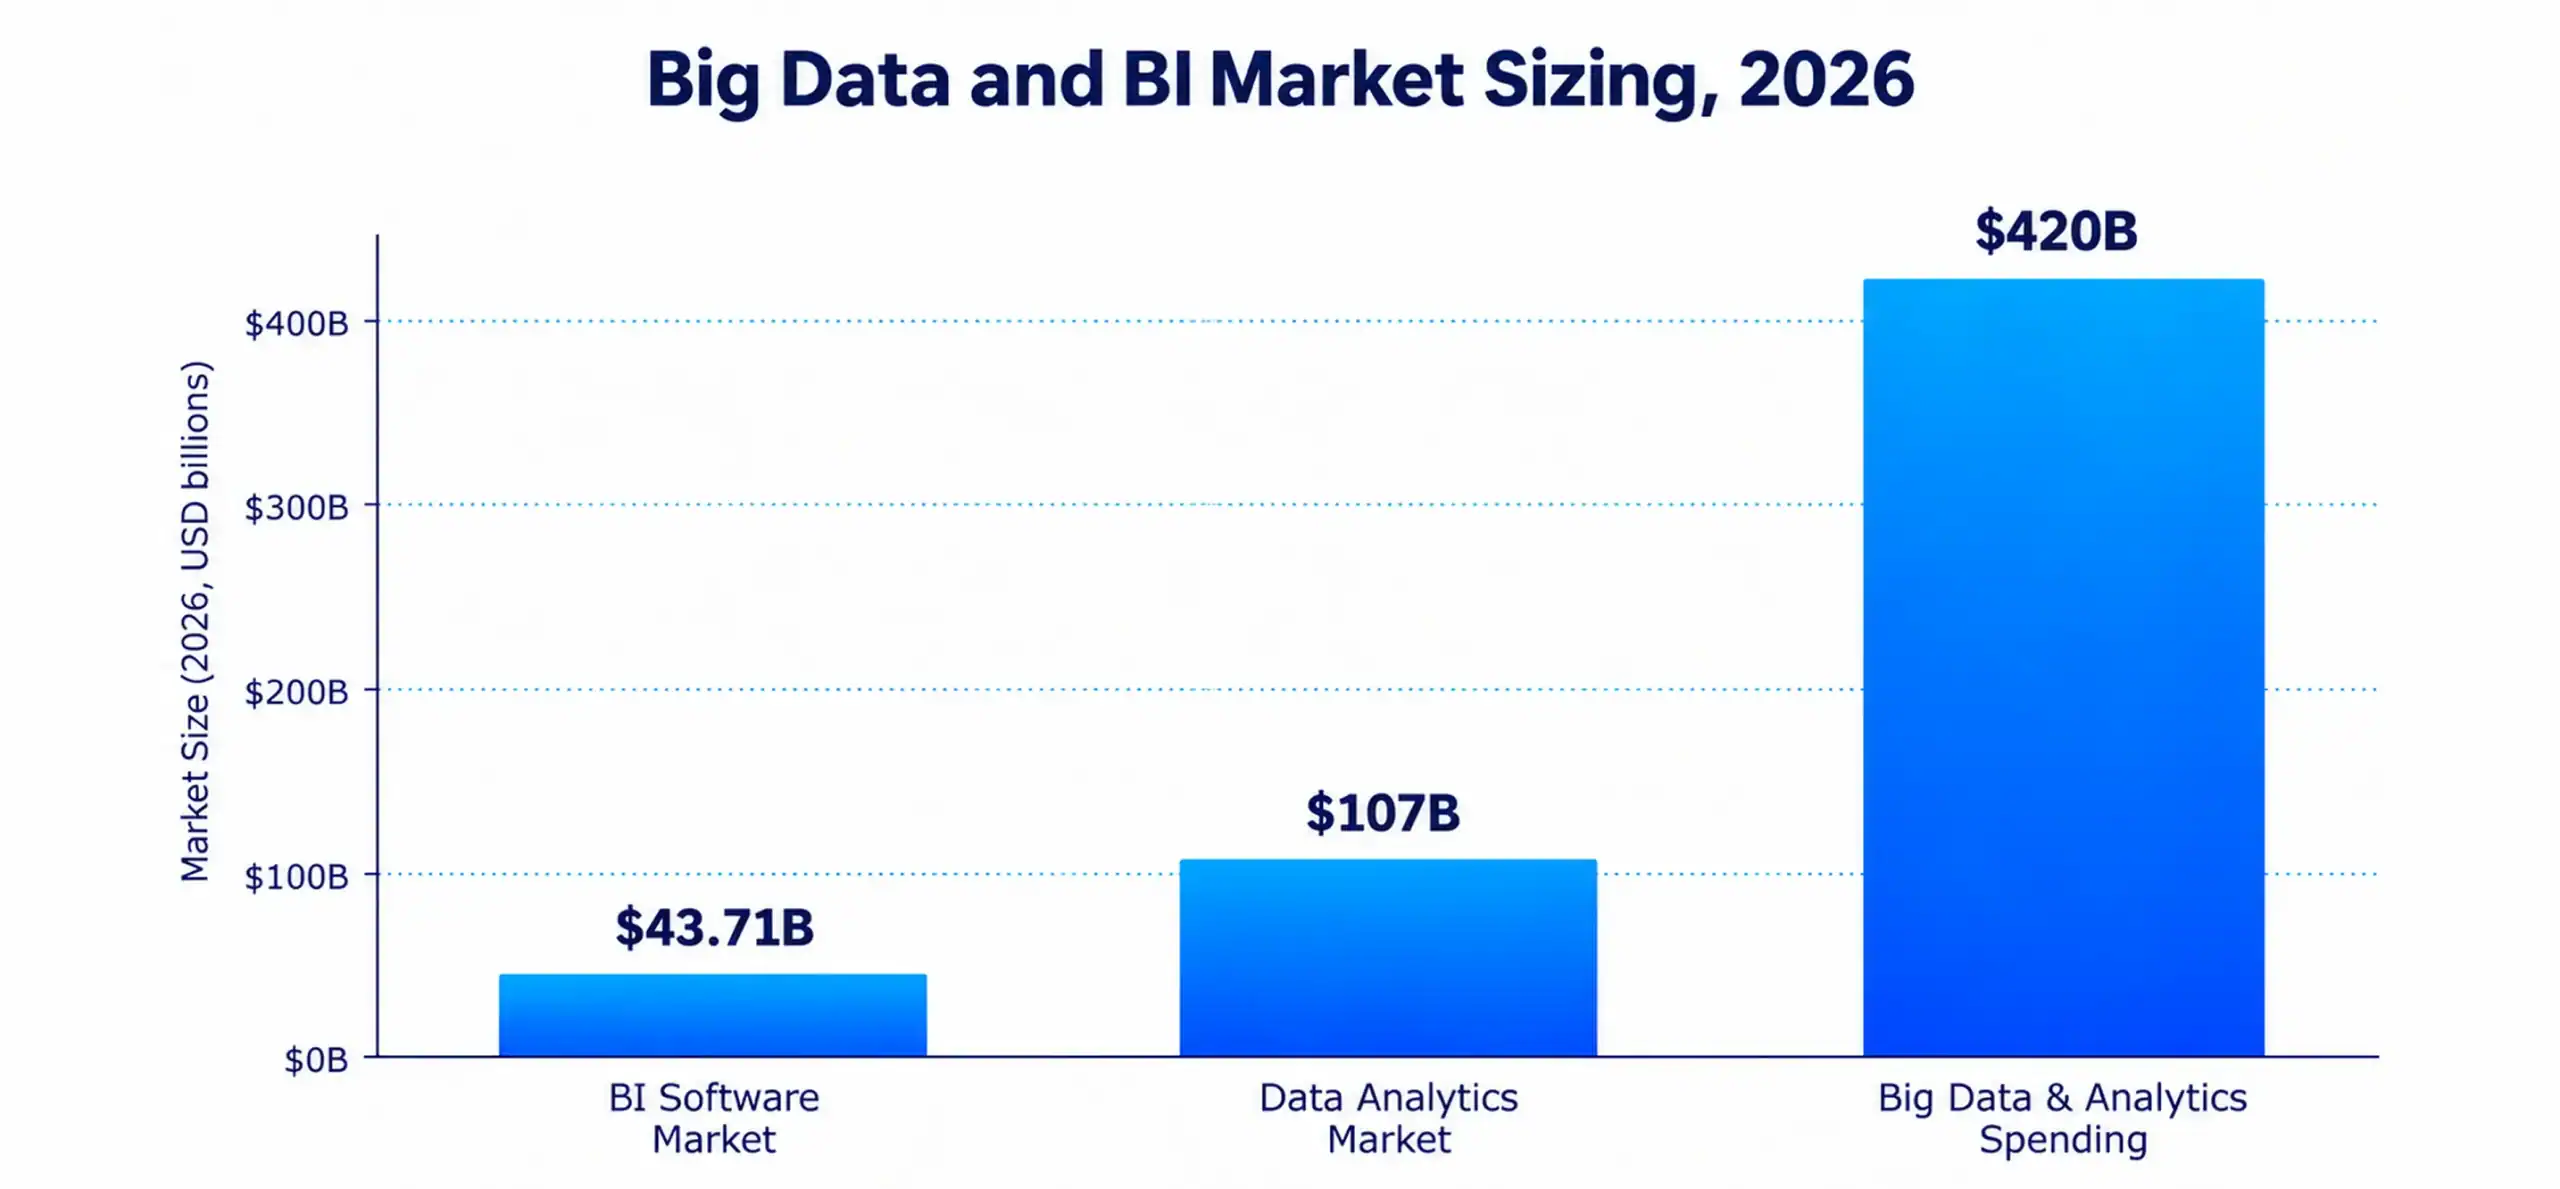
The growing adoption of these capabilities is reflected in the business intelligence software market, which is expected to reach $43.71 billion in 2026. The growth points to continued demand for platforms that help businesses turn growing volumes of data into clear, actionable insights.
What Does a Business Intelligence System Do?
A business intelligence system pulls data from multiple sources, organizes it, and delivers it through reports and dashboards that are easy to read. Most BI systems handle four core jobs.
- Data collection. The system connects to databases, applications, and files across the business.
- Data modeling. It structures raw data into a format built for analysis and comparison.
- Reporting and visualization. It renders results as charts, tables, and interactive dashboards.
- Alerting and distribution. It pushes updates to the right people through email, Slack, or embedded dashboards, so nobody has to go looking for the numbers.
How Does Big Data Drive Business Intelligence?
Big data does not replace business intelligence. Instead, it feeds it. Big data expands what BI can see, how fast it can respond, and how far ahead it can forecast. The sections below show how that works in practice.
1. Big Data Provides the Foundation for BI
Business intelligence is only as effective as the data behind it. Big data brings together information from transactions, third-party sources, applications, and machine-generated logs, giving BI systems a broader view of business performance.
2. Big Data Turns Raw Data Into Business Insights
Raw data becomes useful when it is processed and analyzed. Big data pipelines transform large volumes of disconnected records into actionable business insights, helping companies identify trends, customer behavior, underperforming products, and changing market conditions.
3. Big Data Enables Real-Time Decision-Making
Big data allows BI systems to analyze information as it is generated instead of relying only on batch reports. Global spending on big data and analytics is projected to reach $420 billion in 2026. Real-time analytics can help businesses respond quickly to fraud attempts, inventory shortages, customer issues, and sudden demand changes.
4. Big Data Supports Predictive Analytics
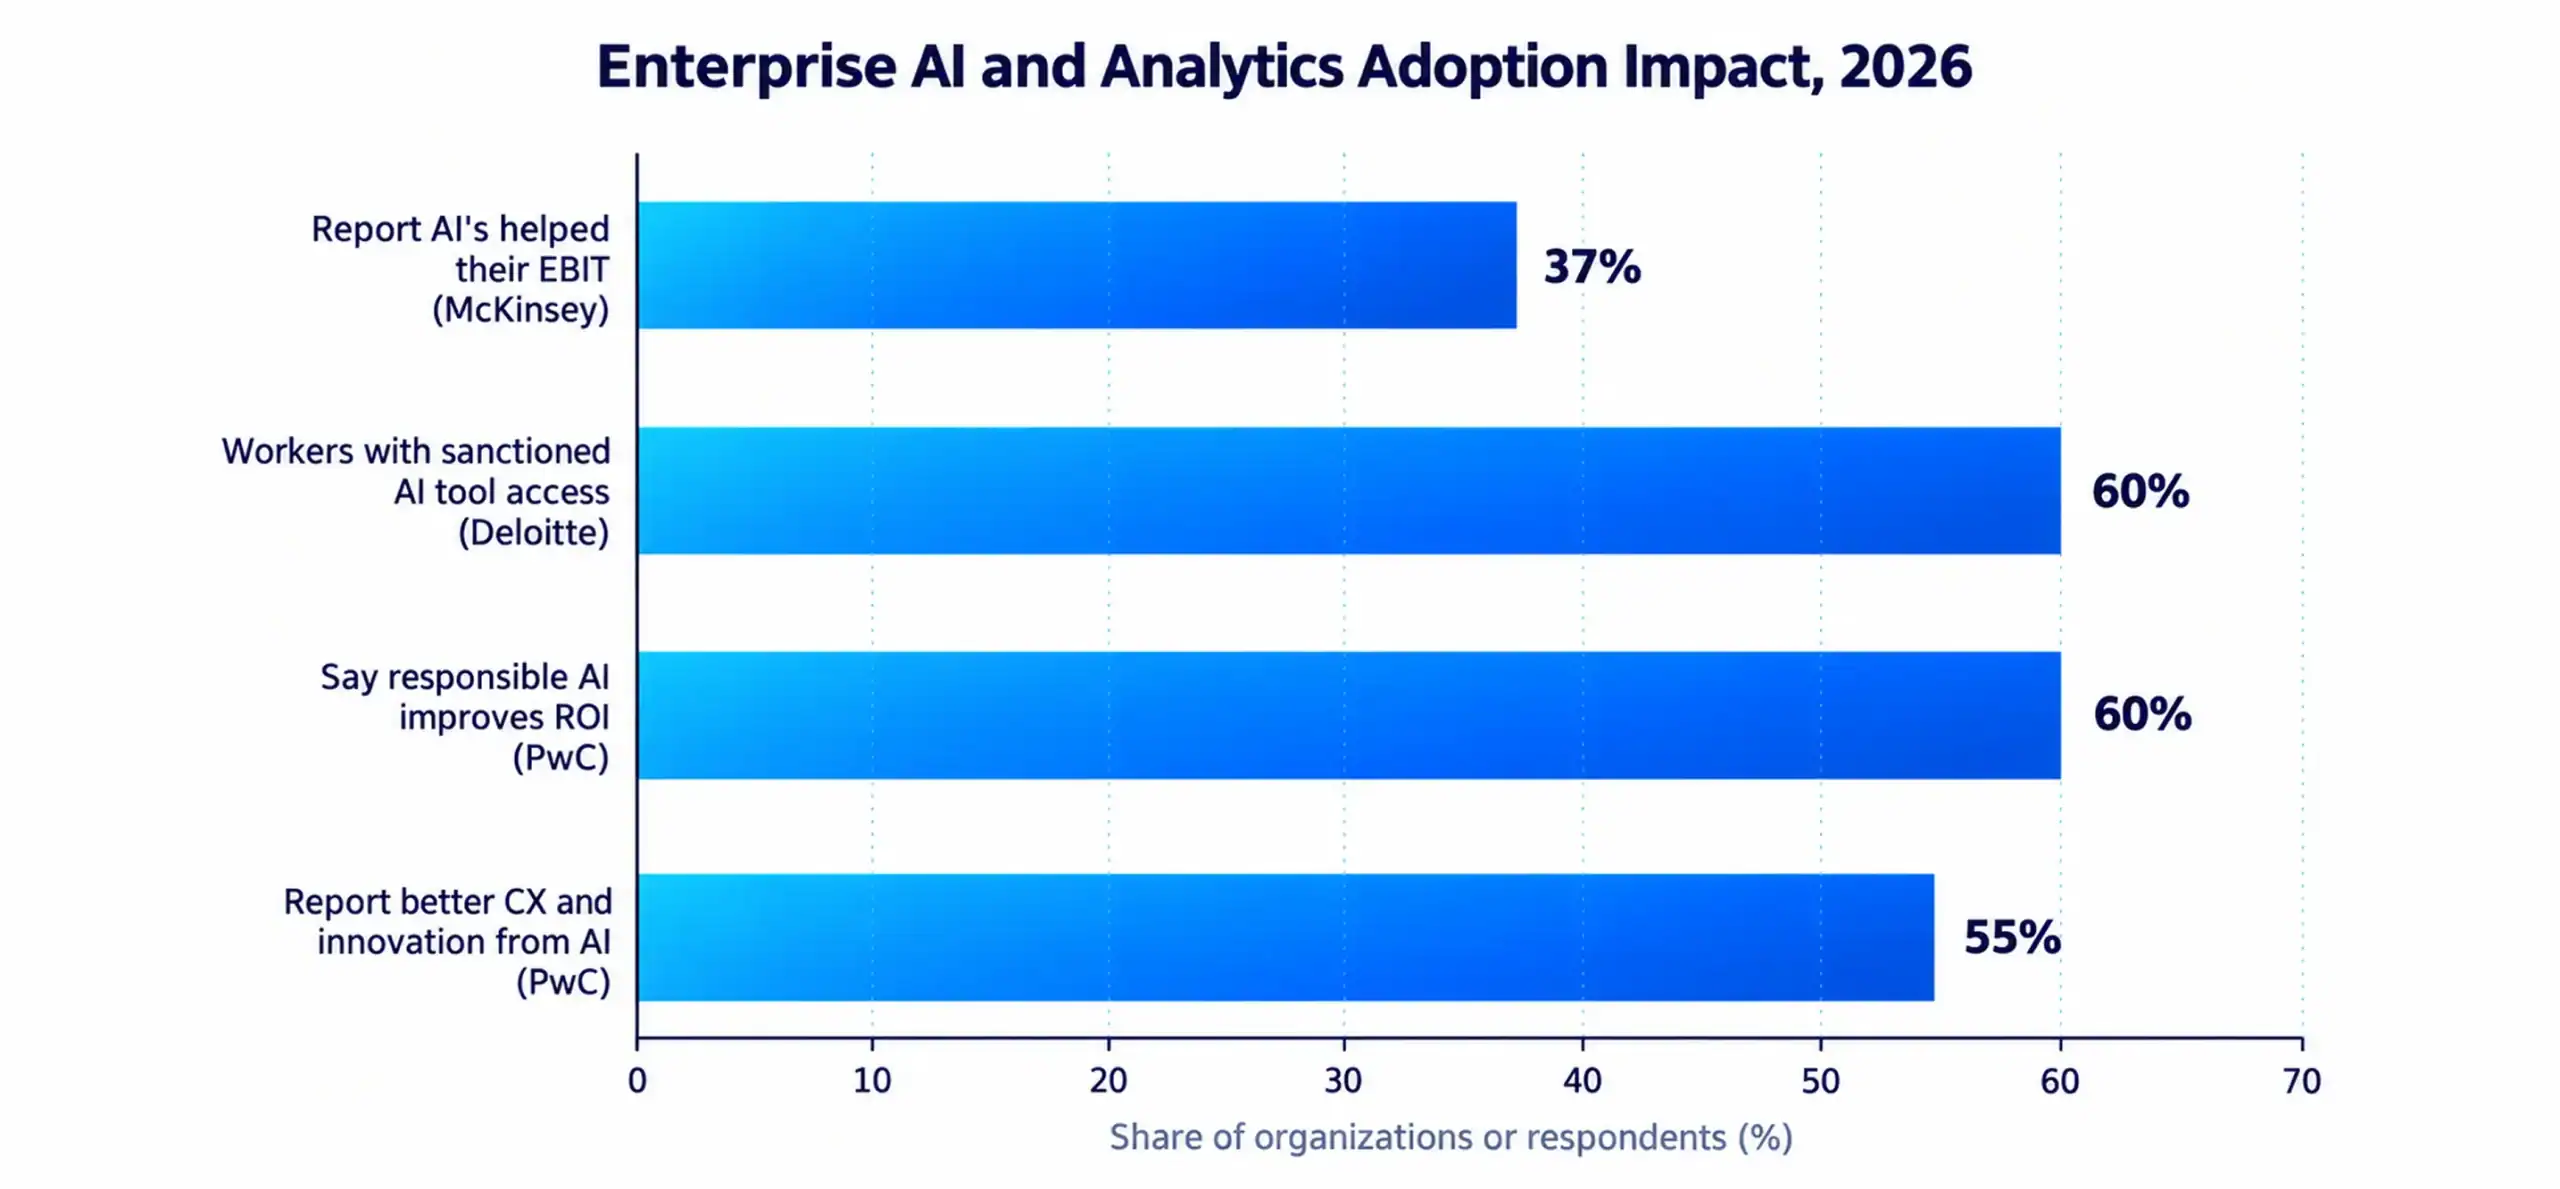
Traditional BI focuses on what happened, while predictive analytics uses big data and machine learning to estimate what may happen next. Large, varied datasets give predictive models more information to identify patterns and forecast outcomes. However, McKinsey’s 2026 State of AI survey found that only 37% of respondents reported enterprise-level EBIT impact from AI, showing that successful implementation depends on connecting analytics to real business decisions.
How Does Big Data Become Business Intelligence?
Getting from raw data to a usable insight is not one step. It is a pipeline, and each stage has to work before the next one can. The infographic below lays out the seven stages that turn big data into business intelligence.
Collecting Data From Multiple Business Sources
The pipeline starts with collection. Data comes from CRMs, ERPs, mobile apps, IoT sensors, support tickets, and social platforms, often in completely different formats. A solid collection layer needs to handle all of them without dropping records or introducing errors.
Storing Data in Scalable Systems
Once collected, data needs somewhere to live that can grow with it. Data lakes hold raw, unprocessed information cheaply, while data warehouses store structured data optimized for fast querying. Most companies end up using both, depending on the workload.
Cleaning and Preparing Data for Analysis
Raw data is messy. Duplicate entries, missing fields, and inconsistent formatting are the norm rather than the exception. Cleaning fixes these issues before analysis starts, because even the best analytics model produces bad answers when it is fed bad data.
Integrating Data Into a Unified Business View
Data rarely arrives pre-aligned. Sales figures might live in one system, customer support tickets in another, and website behavior in a third. Data integration merges these sources into a single, consistent view so different teams stop working from different versions of the truth.
Analyzing Data With BI and Advanced Analytics
With clean, integrated data in place, analysis can begin. This stage combines traditional BI reporting with machine learning models that detect patterns humans would likely miss, from subtle churn signals to unexpected correlations between marketing spend and repeat purchases.
Presenting Insights Through BI Dashboards
Analysis only creates value once someone sees it. Dashboards, visualization tools, and automated reports translate complex analysis into a form a busy manager can scan in under a minute. If a dashboard takes longer than that to interpret, it usually gets ignored.
Turning Insights Into Business Decisions
The final step is the one that actually matters: action. An insight that never changes a decision was not worth generating. Mature organizations build a habit of assigning an owner and a deadline to every significant insight a BI dashboard produces, so analysis turns into outcomes rather than sitting in a report nobody reads twice.
What Are the Benefits of Big Data for Business Intelligence?
The benefits of big data for business intelligence show up across nearly every function in a company, not just in the analytics team.
1. Faster and More Informed Decision-Making
Leaders no longer need to wait for a quarterly report to understand what is happening. Big data BI systems surface trends as they emerge, which shortens the gap between a problem appearing and a decision being made.
2. Improved Customer Understanding
Big data pulls together purchase history, support interactions, browsing behavior, and feedback into one customer profile. That combined view reveals preferences and pain points that no single data source could show on its own.
3. More Accurate Business Forecasting
Forecasts built on broader, cleaner datasets are simply more reliable than forecasts built on gut feel or a handful of spreadsheet columns. Big data BI improves forecast accuracy for demand, revenue, and staffing because it accounts for more variables at once.
4. Increased Operational Efficiency
Analyzing operational data uncovers bottlenecks that are invisible from a manager’s daily view, such as a specific shift, supplier, or process step that consistently slows everything down. Fixing that one bottleneck often improves throughput across the whole operation.
5. Stronger Risk Management
Fraud detection, compliance monitoring, and credit risk scoring all depend on spotting unusual patterns quickly. Big data BI systems flag anomalies in near real time, which gives risk teams a real chance to intervene before damage spreads.
6. Personalized Customer Experiences
Streaming services, retailers, and banks all use big data BI to tailor recommendations, offers, and communication to each individual customer. This kind of personalization drives measurably higher engagement than one-size-fits-all messaging.
7. Better Product and Service Innovation
Usage data reveals which features customers actually rely on and which ones they ignore entirely. That feedback loop, powered by big data, guides product teams toward improvements that customers will actually use instead of features built on assumptions.
What Are the Business Use Cases of Big Data BI?
Different industries apply big data BI in very different ways, though the underlying goal stays consistent: turn information into a competitive edge.
| Industry | Big Data BI Use Case | Business Outcome |
| Retail and E-Commerce | Customer behavior and inventory analytics | Personalized offers and fewer stockouts |
| Financial Services | Fraud detection and credit risk scoring | Faster fraud alerts and better lending decisions |
| Healthcare | Patient records and predictive care models | Earlier diagnoses and lower readmission rates |
| Logistics and Supply Chain | Route optimization and fleet analytics | Lower fuel costs and more reliable delivery windows |
| SaaS and Digital Products | Product usage and churn analytics | Higher retention and better-targeted upsells |
Our blog on Big Data in Healthcare breaks down how systems like electronic health records and predictive analytics platforms work together in a clinical setting.
What Technologies Power Big Data Business Intelligence?
Big data for business intelligence depends on a stack of technologies working together, not any single tool. Each layer below plays a distinct role.
| Layer | Purpose | Common Technologies |
| Storage | Hold raw and structured data | Data lakes, data warehouses |
| Processing | Clean, transform, and move data | ETL tools, data pipelines |
| Compute | Process data at scale | Distributed processing platforms |
| Infrastructure | Host and scale the entire stack | Cloud analytics platforms |
| Intelligence | Detect patterns at scale | Machine learning and AI models |
| Presentation | Turn data into decisions | BI dashboards, visualization tools |
1. Data Lakes and Data Warehouses
Data lakes store raw data in its native format, which makes them ideal for unstructured and semi-structured sources. Data warehouses store data that has already been structured and cleaned, optimized for fast, repeated queries. Most modern data architecture uses both together, routing raw data into a lake first and promoting cleaned, modeled data into a warehouse for BI consumption.
2. Cloud Computing and Scalable Data Storage
Cloud analytics platforms let companies scale storage and compute up or down as data volume changes, without buying and maintaining physical servers. According to IDC’s Data Age forecast, nearly half of the world’s data was expected to sit in public cloud environments by 2025, and that share has only grown since.
This shift also makes cloud-native architecture increasingly relevant for data-intensive applications. Our guide to achieving excellence with cloud-native solutions explains how cloud-native applications differ from simply hosting an application in the cloud.
3. Data Integration and ETL Tools
ETL processing, which stands for extract, transform, load, moves data from source systems into a warehouse or lake in a consistent, usable format. Without solid data integration, teams end up duplicating work just to reconcile numbers that should already match.
4. Big Data Processing Platforms
Distributed processing platforms split massive datasets across many machines so they can be processed in parallel instead of one record at a time. This approach is what makes it possible to analyze terabytes of data in minutes rather than days.
5. Business Intelligence and Data Visualization Tools
Modern visualization tools turn processed data into interactive dashboards that let users filter, drill down, and explore data without writing a single query. Self-service analytics has made this layer accessible to non-technical staff, which means fewer requests piling up in the data team’s queue.
6. Artificial Intelligence and Machine Learning
Machine learning models sit on top of the data pipeline to detect patterns, forecast outcomes, and automate decisions at a scale manual analysis cannot match. This is also where AI-powered BI is heading next, and we cover that shift in more detail later in this guide.
What Are the Main Challenges of Big Data for BI?
Even well-funded big data initiatives run into predictable obstacles. Recognizing them early makes them far easier to manage.
1. Poor Data Quality and Accuracy
Inaccurate, incomplete, or outdated data undermines every analysis built on top of it. No BI dashboard, however well designed, can compensate for bad inputs.
2. Data Silos and Integration Complexity
When departments store data in separate, disconnected systems, no single team ever sees the full picture. Breaking down these silos is often more of an organizational challenge than a technical one.
3. Data Privacy and Security Risks
As more data flows through more systems, the attack surface grows with it. IDC’s research estimated that almost 90% of the data in the global datasphere would require some level of security by 2025, yet less than half of it would actually be protected. That gap is exactly what strong data governance is meant to close.
4. High Infrastructure and Implementation Costs
Storage, compute, licensing, and staffing all add up quickly, especially for companies still running on legacy systems. Cloud platforms have lowered the barrier to entry, but they have not eliminated the cost of doing this properly.
5. Shortage of Skilled Data Professionals
Data engineers, data scientists, and BI analysts remain in short supply relative to demand. As access to AI tools expands, this shortage becomes even more visible. Deloitte’s research found that around 60% of workers now have access to sanctioned AI tools, which raises the bar for the skills, oversight, and metadata management needed to use them responsibly.
6. Dashboard Overload and Misleading Metrics
Too many dashboards, tracking too many metrics, can be just as harmful as too little data. When everything is highlighted, nothing is prioritized, and teams lose track of the numbers that actually drive decisions.
What Are the Best Practices for Implementing Big Data BI?
Getting big data for business intelligence right depends less on buying more tools and more on following a disciplined process. These practices consistently separate the companies that scale from the ones that stall.
Define Clear Business Goals and KPIs
Start with the business question, not the technology. A big data initiative without a defined goal tends to produce dashboards nobody asked for and nobody uses.
Create a Unified Data Strategy
A documented data architecture strategy aligns every team on where data lives, who owns it, and how it flows between systems. Without that alignment, integration work has to be redone every time a new source gets added.
Improve Data Quality Before Analysis
Invest in data cleaning and validation before scaling analytics efforts. Fixing quality issues after a model is already in production costs far more than catching them at the source.
Select Scalable BI Infrastructure
Choose storage, processing, and cloud analytics platforms that can grow with your data volume, not just handle what you have today. Migrating an entire data architecture later is disruptive and expensive.
Design Dashboards Around Business Decisions
Every dashboard should map back to a specific decision someone needs to make. If a report does not change what anyone does, it is worth cutting.
Establish Strong Data Governance
Data governance sets the rules for data access, quality standards, and metadata management across the organization. It also determines how responsibly AI and analytics tools get used once they are deployed.
Train Employees to Use BI Tools
Even the best BI platform fails if the people meant to use it never learn how. Ongoing training keeps adoption high and prevents self-service analytics tools from sitting unused.
How Will Big Data Shape the Future of Business Intelligence?
The direction of travel is clear: BI is becoming faster, more automated, and more accessible to non-technical users.
AI-Powered Business Intelligence
AI-powered BI platforms are starting to generate insights automatically instead of waiting for someone to build a report. Deloitte’s research on enterprise AI readiness found that 58% of technology leaders now consider themselves prepared or fully prepared to modernize their platforms and build these capabilities, which suggests this shift is closer than many teams assume.
Natural Language Data Queries
Instead of writing SQL or building a filter manually, users are starting to simply ask a question in plain language and get an answer back. This lowers the barrier for non-technical staff to explore data on their own.
Real-Time and Streaming Analytics
As real-time analytics becomes standard rather than a premium feature, the gap between an event happening and a business responding to it will keep shrinking further.
Data Democratization Across Organizations
Self-service analytics tools are putting data access directly in the hands of marketing, sales, and operations teams, not just the analytics department. This spreads data literacy across the business rather than concentrating it in one team.
Advanced Data Security and Governance
As AI and analytics tools spread further into daily workflows, data governance and metadata management will need to scale right alongside them. Companies that treat governance as an afterthought will find it far harder to catch up later than the ones who build it in from the start.
How Cubix Brings Big Data and Business Intelligence Together
Big data for business intelligence only pays off when the underlying architecture, integration, and governance are built correctly from day one. That is precisely where most in-house efforts get stuck.
Our big data development services cover the full pipeline: data strategy, storage architecture, integration, and analytics apps built around your specific business challenges. On the BI side, our business intelligence services handle everything from BI consulting and data warehousing to predictive analytics, interactive dashboards, and ongoing support as your data needs grow.
For companies exploring how AI fits into this picture, our blog on enterprise AI readiness is also worth a read before you start scoping a project.
Whether you are starting from scratch or fixing a system that never scaled, Cubix has the data engineers, BI developers, and AI specialists to build something your teams will actually use.
Frequently Asked Questions
1. What is big data and how does it differ from traditional data?
Big data consists of large, fast-moving, and varied datasets that traditional tools may struggle to process. Unlike traditional data, it can include structured records, logs, images, video, and sensor feeds at scale.
2. How does big data improve business intelligence?
Big data gives business intelligence systems more information to analyze, helping businesses identify trends, improve forecasts, make faster decisions, and gain deeper insights into customers and operations.
3. What are the main challenges of big data analytics?
The main challenges include poor data quality, data silos, integration complexity, privacy and security risks, high implementation costs, and a shortage of skilled data professionals.
4. What technologies power big data analytics?
Big data analytics relies on data lakes, data warehouses, ETL tools, distributed processing platforms, cloud computing, BI dashboards, data visualization tools, and AI and machine learning.
5. How much does big data analytics cost?
Big data analytics costs vary based on data volume, infrastructure, integration requirements, tools, and staffing. Cloud platforms can reduce upfront infrastructure costs, but implementation and ongoing management still require investment.
6. What’s the difference between big data and analytics?
Big data refers to large and complex datasets, while analytics is the process of examining that data to identify patterns, trends, and insights that support business decisions.
7. How do you implement a big data strategy?
Start by defining business goals and KPIs, then create a data architecture, improve data quality, integrate data sources, select scalable BI infrastructure, establish governance, and train employees to use analytics tools.
8. What ROI can enterprises expect from big data?
ROI varies by business and use case. Big data can generate value through better forecasting, improved operational efficiency, personalized customer experiences, fraud detection, and stronger decision-making.
9. Which industries benefit most from big data?
Retail, financial services, healthcare, logistics, supply chain, SaaS, and digital products benefit from big data through use cases such as customer analytics, fraud detection, predictive care, route optimization, and churn analysis.
10. How does AI/ML enhance big data analytics?
AI and machine learning analyze large datasets to detect patterns, forecast outcomes, identify anomalies, and automate decisions. They extend traditional BI from reporting what happened to predicting what may happen next.